
Statistics Canada released June inflation data this morning. The consumer price index climbed 0.2% in June and is 1% higher than a year earlier; this is in-line with expectations. Energy prices climbed 3.3% in the month of June, following an increase of 2.9% in May. However, drastic declines in energy costs in the second half of 2014 continue to depress annual inflation numbers. Year-over-year, energy costs are still down 9%.
Core inflation, which eliminates volatile items like food and energy, was 2.3% for the year ending in June, marginally higher than the expected 2.2%. Excluding energy, the CPI rose 2.1% for the year versus an increase of 2.2% for the year ending in May.
Changes in Major Components of the Index
Once again, growing food prices, largely due to higher price tags on meat, drove annual inflation. The cost of meat rose 0.3% in June, matching the change May but slowing compared to previous months. Grocery store bills were up 3.4% year-over-year, including 6.6% higher prices for meat. The cost of shelter was 1% higher on an annual basis as home insurance and mortgage costs continue to climb, up 9% year-over-year.
On a monthly basis, transportation prices increased more than any other component of the CPI, rising 1.2% in June, following a 1.1% jump in May. These changes were driven by higher prices at the pump. Although gasoline prices rose 6% in June, they are still 14.1% lower than they were a year ago. Transportation was also the only component to post a year-over-year decline, making June the eighth consecutive month of annual declines for for that component.
Clothing and footwear and health and personal care were the two components of CPI that declined on a non-seasonally adjusted basis in June. Clothing and footwear prices were down 2.1% for the month and health and personal care costs fell slightly (0.2%).
Seasonal adjustments allow us to compare monthly inflation numbers by adjusting for regular cyclical price fluctuations. On a seasonally adjusted basis, the CPI climbed 0.4% in June, matching the increase in May and following a decline in April. There were no seasonally adjusted declines in any of the major components of the CPI. Although, health and personal care posted no monthly change.
The core index, considered a good indication of underlying price trends, is showing signs of acceleration this year. Monthly, seasonally adjusted changes in April, May and June were 0.1%, 0.2% and 0.3% respectively.
| Consumer Price Index, major components – Seasonally adjusted | % Change June | % Change May | % Change April |
| All-items (100%) | 0.4 | 0.4 | -0.1 |
| Food (16.41%) | 0.1 | 0.4 | 0.4 |
| Shelter (26.08%) | 0.2 | 0.1 | -0.2 |
| Household operations, furnishings and equipment (13.14%) | 0.2 | 0.2 | 0.4 |
| Clothing and footwear (6.08%) | 0.1 | -0.2 | -0.3 |
| Transportation (19.1%) | 1.3 | 0.6 | 0.1 |
| Health and personal care (4.73%) | 0 | 0.3 | 0.2 |
| Recreation, education and reading (10.89%) | 0.4 | 0.8 | -0.8 |
| Alcoholic beverages and tobacco products (2.86%) | 0.1 | 0.3 | 0.5 |
| Bank of Canada’s core index | 0.3 | 0.2 | 0.1 |
| All-items excluding food and energy | 0.2 | 0.3 | 0.1 |
| Source: CANSIM table 326-0022. |
Inflation by Provence
Saskatchewan saw the most drastic price increases for the year ending in June (1.9%). Inflation was also high in Alberta, rebounding to 1.7% following a much smaller annual increase, only 0.6%, for the year ending in May. PEI was the only provence to post lower prices for the year, down 0.1%.
| Consumer Price Index for the provinces | % change May 2014 to May 2015 | % change June 2014 to June2015 |
| Canada (100%) | 0.9 | 1.0 |
| Ontario (38.9%) | 0.9 | 0.1 |
| Quebec (21.6%) | 1.2 | 1.0 |
| British Columbia (13.9%) | 0.8 | 0.8 |
| Alberta (13.2%) | 0.6 | 1.7 |
| Manitoba (3.2%) | 0.5 | 1.0 |
| Saskatchewan (3.0%) | 1.5 | 1.9 |
| Nova Scotia (2.5%) | 0.5 | 0.8 |
| New Brunswick (1.9%) | 0.6 | 1.0 |
| Newfoundland and Labrador (1.4%) | 0.3 | 0.6 |
| Prince Edward Island (0.3%) | -0.7 | -0.1 |
| Source: CANSIM table 326-0022 |
Lowers Interest Rates Target Higher Inflation
As expected, inflation continues to flounder well below the Bank of Canada’s target of 2%. The BoC’s decision on Wednesday to lower the overnight rate by 0.25% for the second time this year should not have come as a major surprise. With increasing chatter over the possibility that Canada has slipped into another recession, the Bank acted to stimulate spending and bring inflation closer to their target.
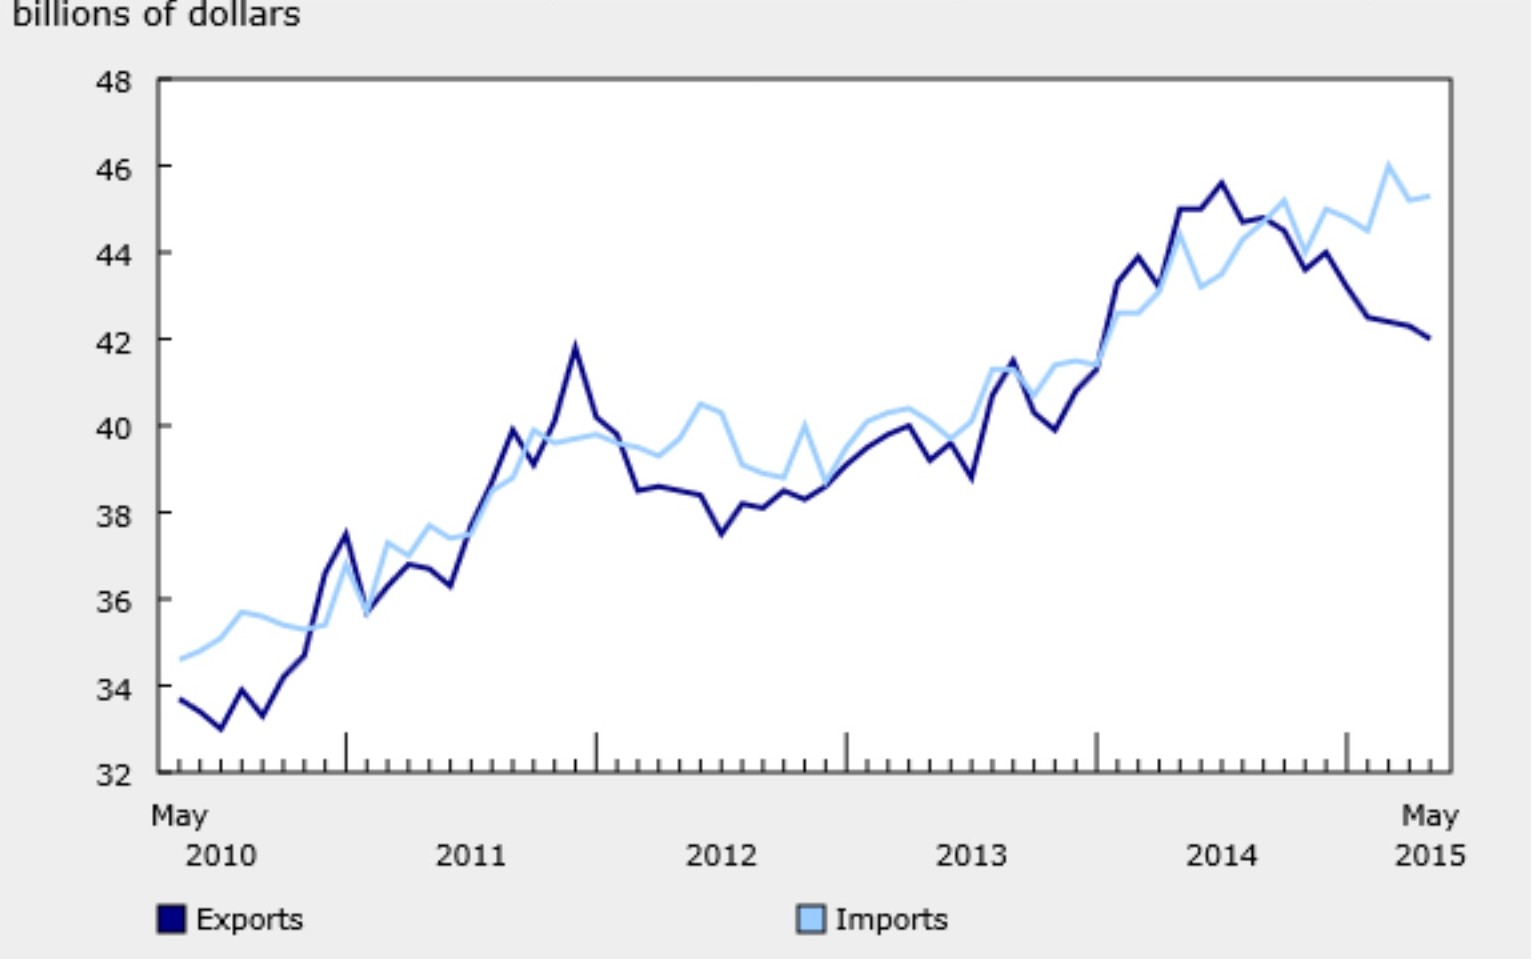
The rate cut came alongside the Bank’s revised forecast for economic growth over the next two and a half years. 2015 GDP growth expectations were lowered from 1.9% to 1.1% due entirely to a decline in the contribution from exports. Weak exports have been a major concern and source of confusion for the Bank of Canada. Canada’s trade deficit has reached new highs in 2015 as exports fell nearly 7% for the year ending in June.
The following graph shows Canada’s imports and exports over the past 5 years. Exports have been falling for over a year despite the lower Loonie. Imports have continued to rise despite becoming more expensive to the Canadian market.
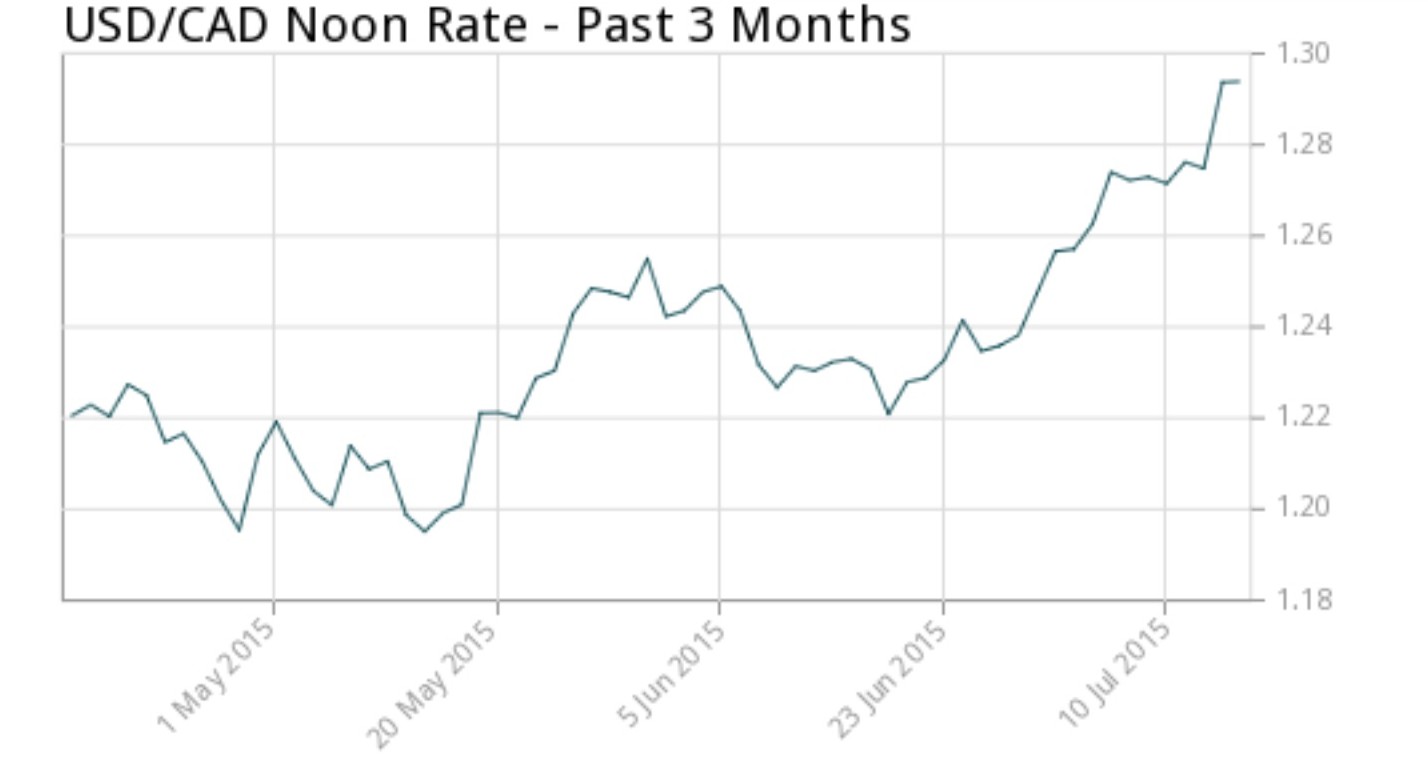
The rate cut conveniently sent the Loonie into free fall, hitting its lowest value in six years versus the U.S. dollar. The hope is that deflating the dollar will stimulate Canada’s exports. The spike in the price of U.S. dollars in July 2015 that is illustrated in the graph below, is the market’s reaction to the BoC’s decision to cut interest rates.
The declining Loonie also translates into higher prices at home as we pay more for imports. The U.S. is our primary trading partner. The BoC estimates that the exchange rate will add 1.5% to domestic price levels in 2015, bringing inflation much closer to the target rate and even staving off deflation. This also gives Canada one of the highest rates of inflation of all developed countries.
The rate cut has largely been criticized because it will drive Canadians even further into debt. Unprecedented levels of household debt has been cited repeatedly by the Bank as a major risk to the economy. Lower rates will translate into increased borrowing and cheaper mortgages. This will add fire to the already hot, and potentially overheated, housing market. Although the BoC maintains their view that we are not facing a housing bubble.
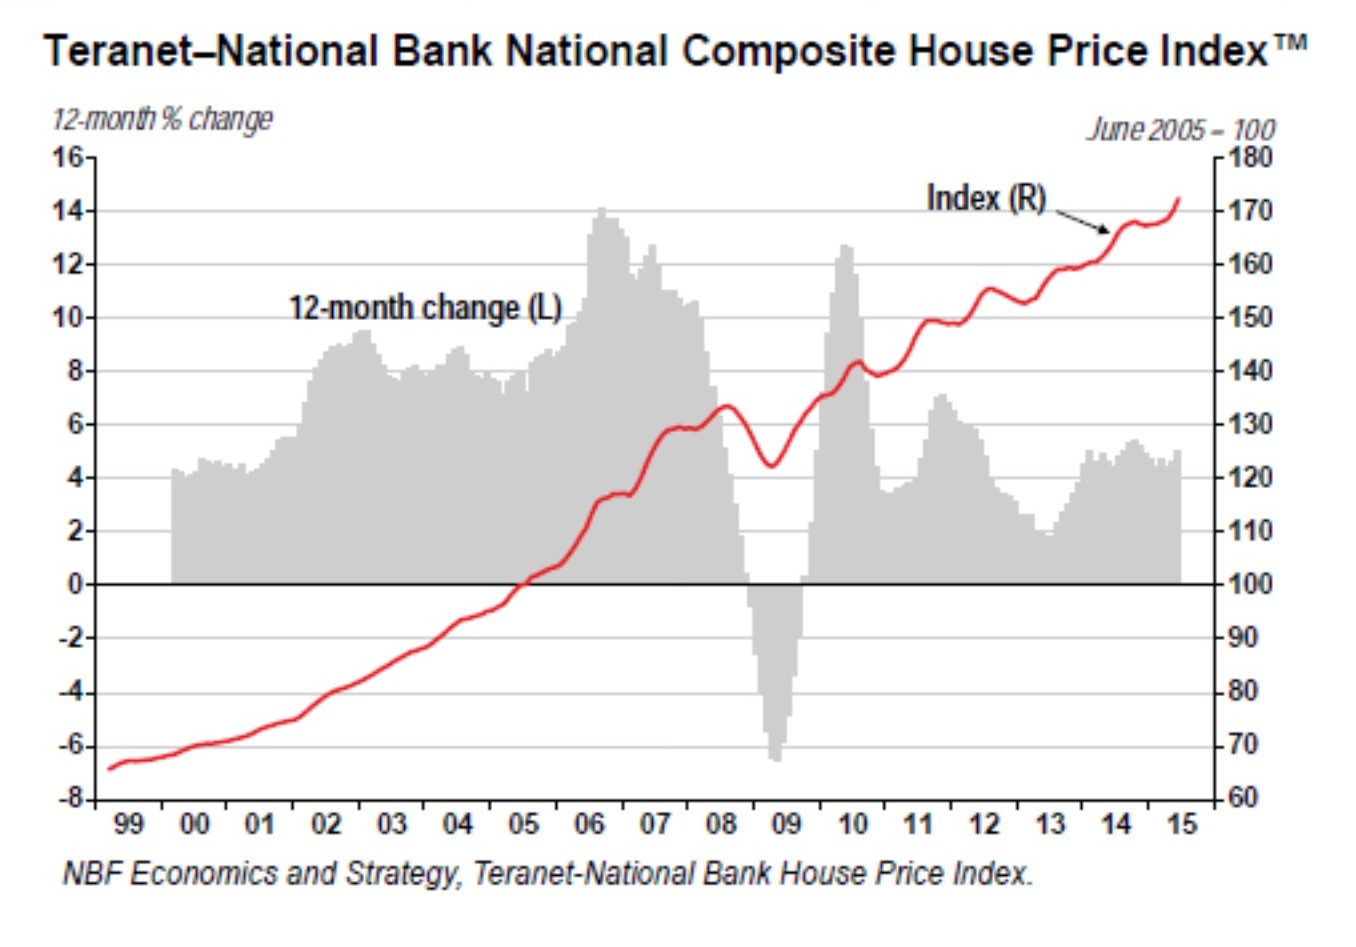
Housing prices continued to rise in June. The Teranet-National Bank Composite House Price Index shows repeat sales of single family homes. It was 1.4% higher in June and 5.1% higher year-over-year.
Outlook
Technically a recession is defined as two consecutive quarters of economic contraction so we will not know if this is the case until second quarter GDP numbers are released on September 1st. However, there is good economic news to report and such technical indicators are not necessarily indicative of economic realities. Consumer confidence has remained high. Unemployment has not climbed significantly and is slightly lower than it was in 2014. We have largely been struck with a massive decline in energy exports and falling oil prices have been more painful than expected. At the same time, no one is panicking and the BoC expects that real economic growth will drive a sustainable inflation rate of around 2% by the end of 2017. They also expect growth to resume in the second half of this year. According to Porter, an economist at BMO, “if this is a recession, it may be the least unpleasant one in Canadian history.“

Emily is a Canadian financial blogger with multiple degrees in economics and extensive professional experience as a financial analyst. She was formerly a Ph.D. candidate at the University of Guelph's School of Agricultural Economics. Before that, she received an MA from the University of San Francisco in International Development Economics. She also has a BA in Math with a minor in Economics.