
January’s inflation numbers were stronger than expected and the highest recorded since November 2014. According to today’s report from Statistics Canada, headline inflation was 2% for the 12-months ending in January. Expectations had been closer to 1.8%, following an inflation reading of 1.6% for the year ending in December.
With the Loonie hovering around a 13-year low versus the US dollar, the price of imported goods rose in January. Food, especially fresh food in the winter months, is largely imported and Canadians are facing significantly higher prices at the grocery store. The food index was up 4% year over year in January compared to 3.7% in December. Food accounts for 16.4% of the overall price index, which reflects the share of spending that an average Canadian family allocates towards food.
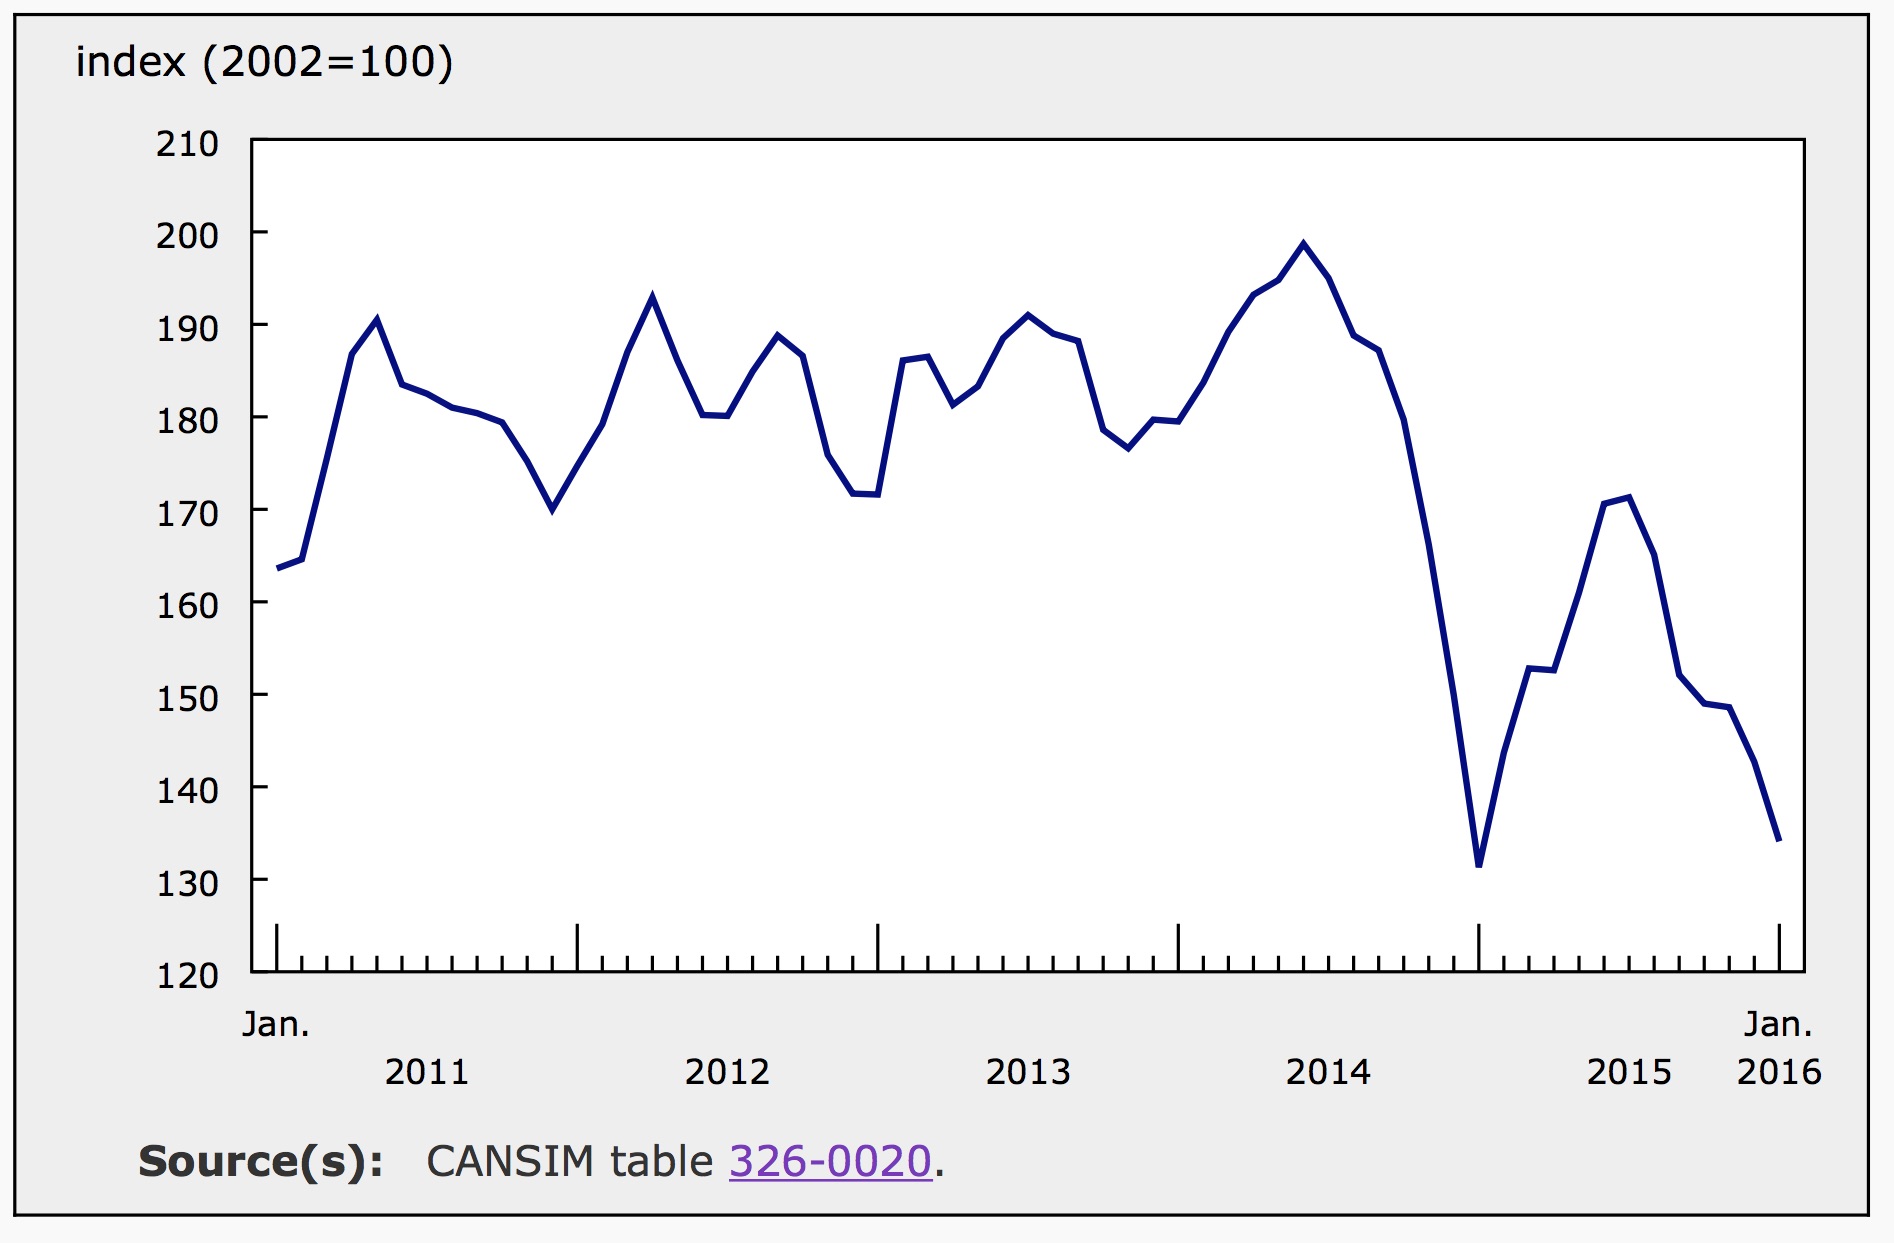
The index for gasoline posted a 2.1% annual increase in January, which is its first annual increase since October 2014. Although gasoline prices continued to slide in the month of January, down 6% month over month, the annual calculations omit the massive slide in gas prices in the previous January. The gasoline index was down 26.9% for the year ending January 2015. The graph below tracks the gasoline index over 5 years.
Core inflation, which excludes volatile items like food and energy, ticked up in January, rising 2% over the 12-month period, following a 1.9% rise in December. For the month of January, core prices posted an increase of 0.2%, the same seasonally adjusted annual increase as December.
12 Month Inflation
For the year ending in January, prices were higher in all but one component of the consumer price index. The index for clothing and footwear slipped 0.3% year over year.
The index for food posted the largest annual increase, up 4% following a year over year increase of only 1.5% in December. The index for food purchased from stores grew 4.6% for the year ending in January while the index for food from restaurants was 2.6% higher for the same period. Higher prices for fresh fruit and vegetables was the main driver of inflation within the food index and the overall index. The price of fresh fruit was up 12.9% year over year, while fresh vegetable prices saw a drastic 18.2% rise.
Shelter, the largest component of the overall price index, accounts for 26.8% of consumer spending. Shelter costs were up 1.1% for the year ending in January, matching December’s growth. The changing cost of homeowner’s home and mortgage insurance is the most significant component impacting the shelter index. The subindex for homeowners insurance was up 8.9% year over year in January. In December this number was 10.1%.
Seasonally Adjusted Prices in January
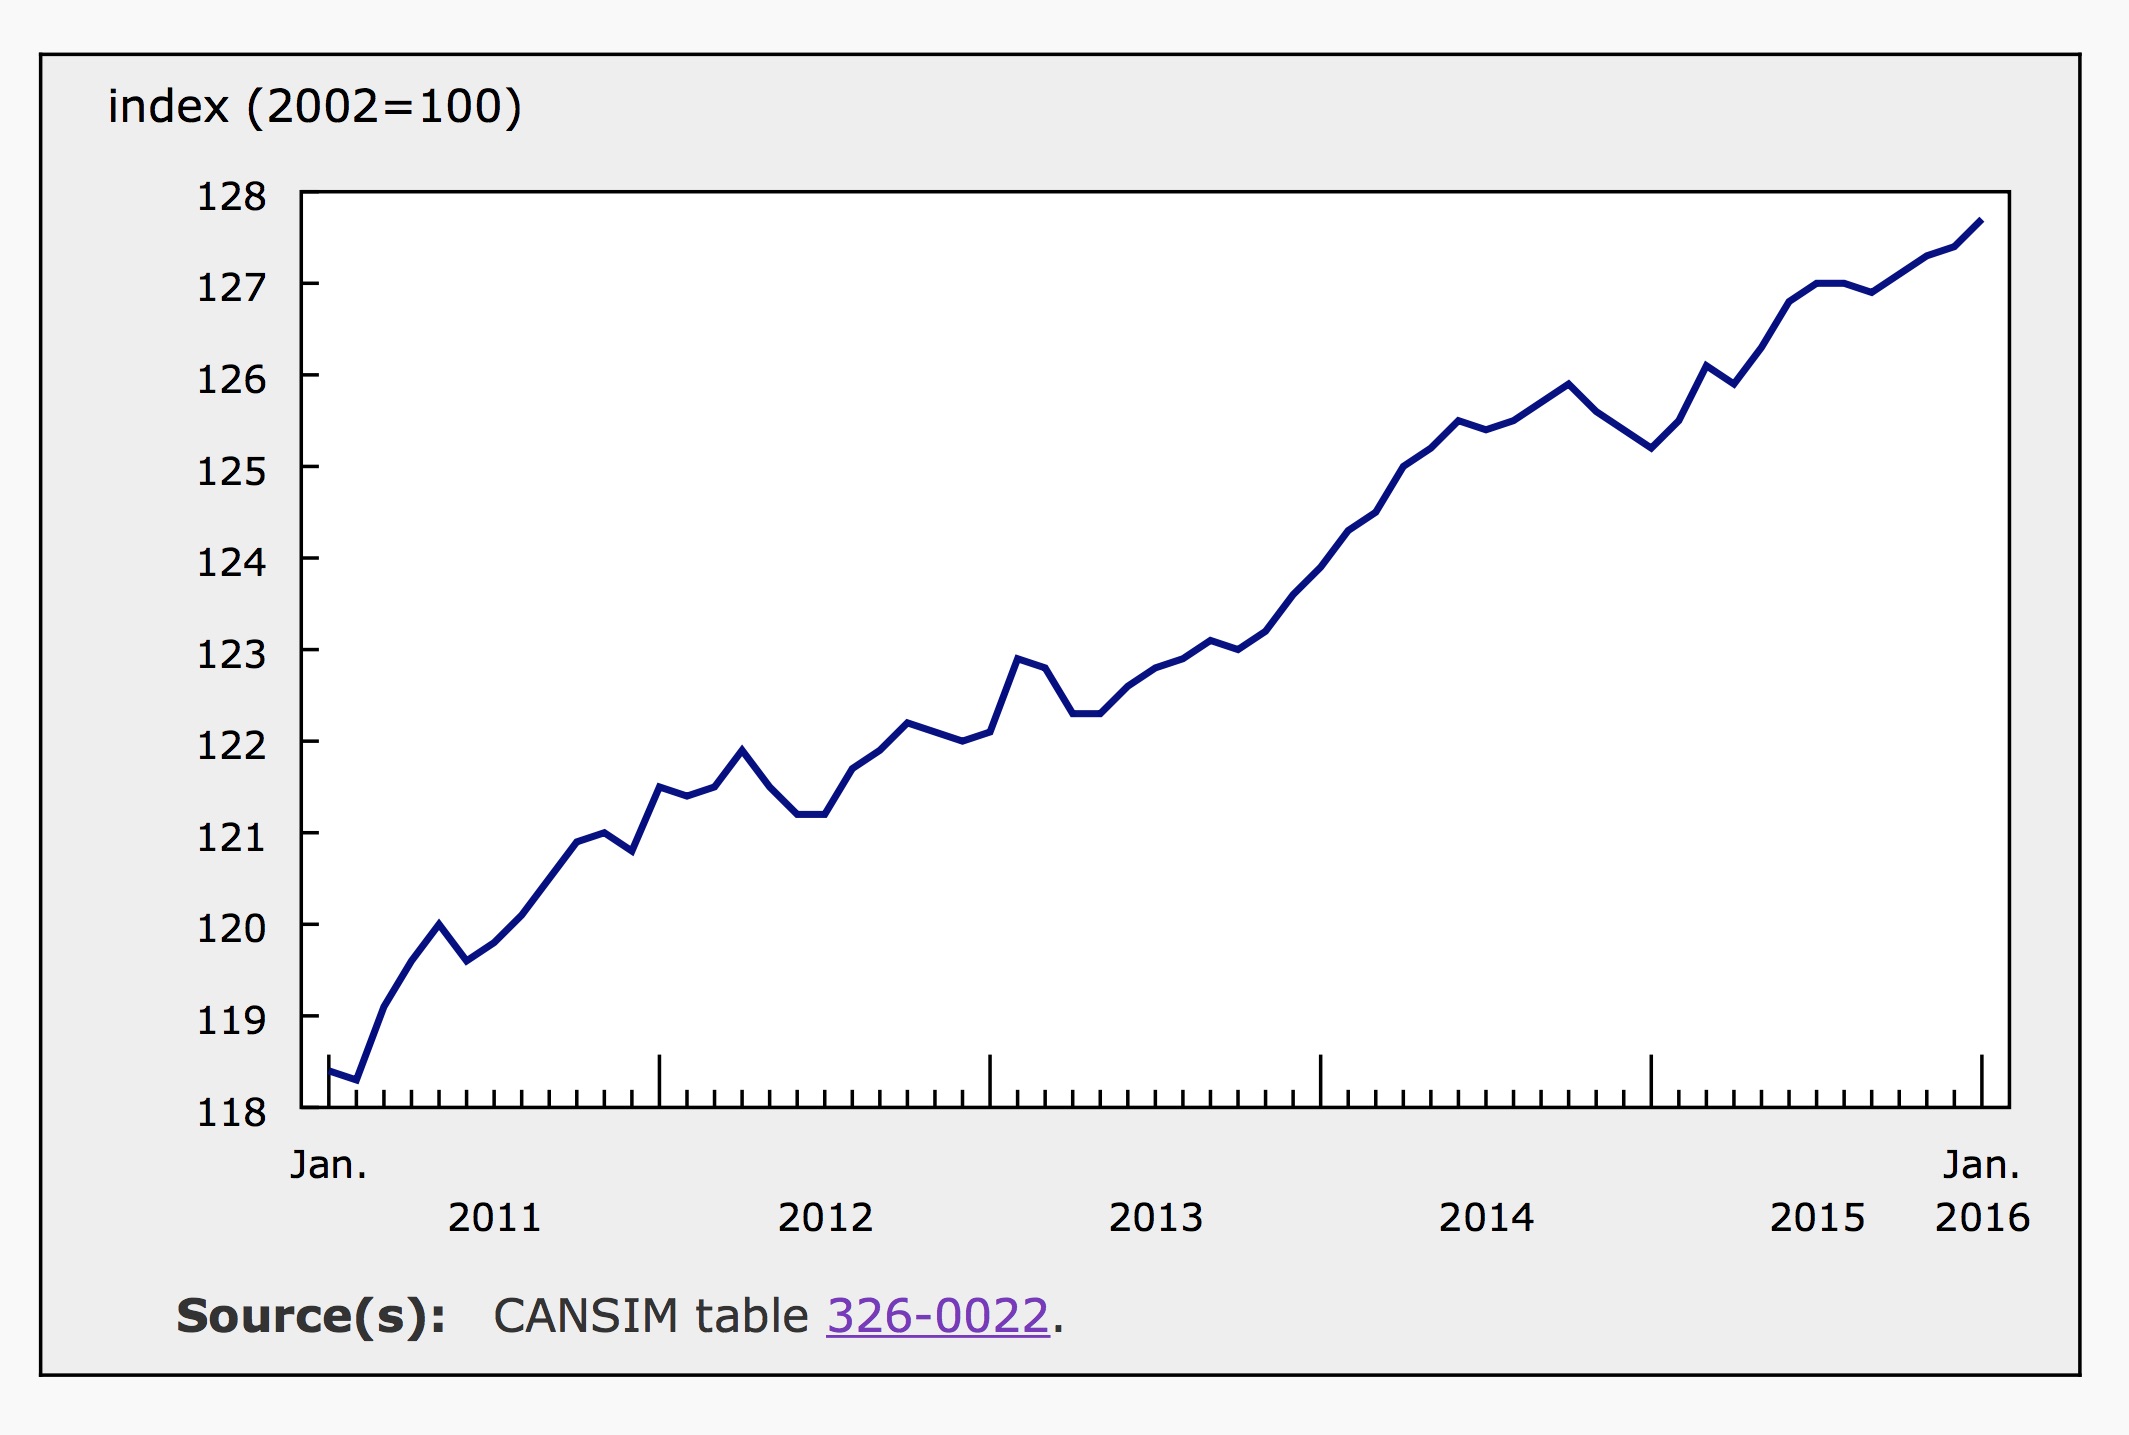
Seasonally adjusted prices rose 0.2% in January, well above the expectation that this monthly number would be a negative 0.1%. In December 2015, seasonally adjusted prices rose 0.1%. The graph below shows the growth of seasonally adjusted prices over 5 years.
Following seasonal adjustments, prices were higher in six of the eight major components of the price index for the month. The index for clothing and footwear and the index for transportation both declined in January, down 0.4% and 0.8% respectively. Food prices, the main driver of inflation in January, were up a seasonally adjusted 0.6% month over month.
Inflation by Province
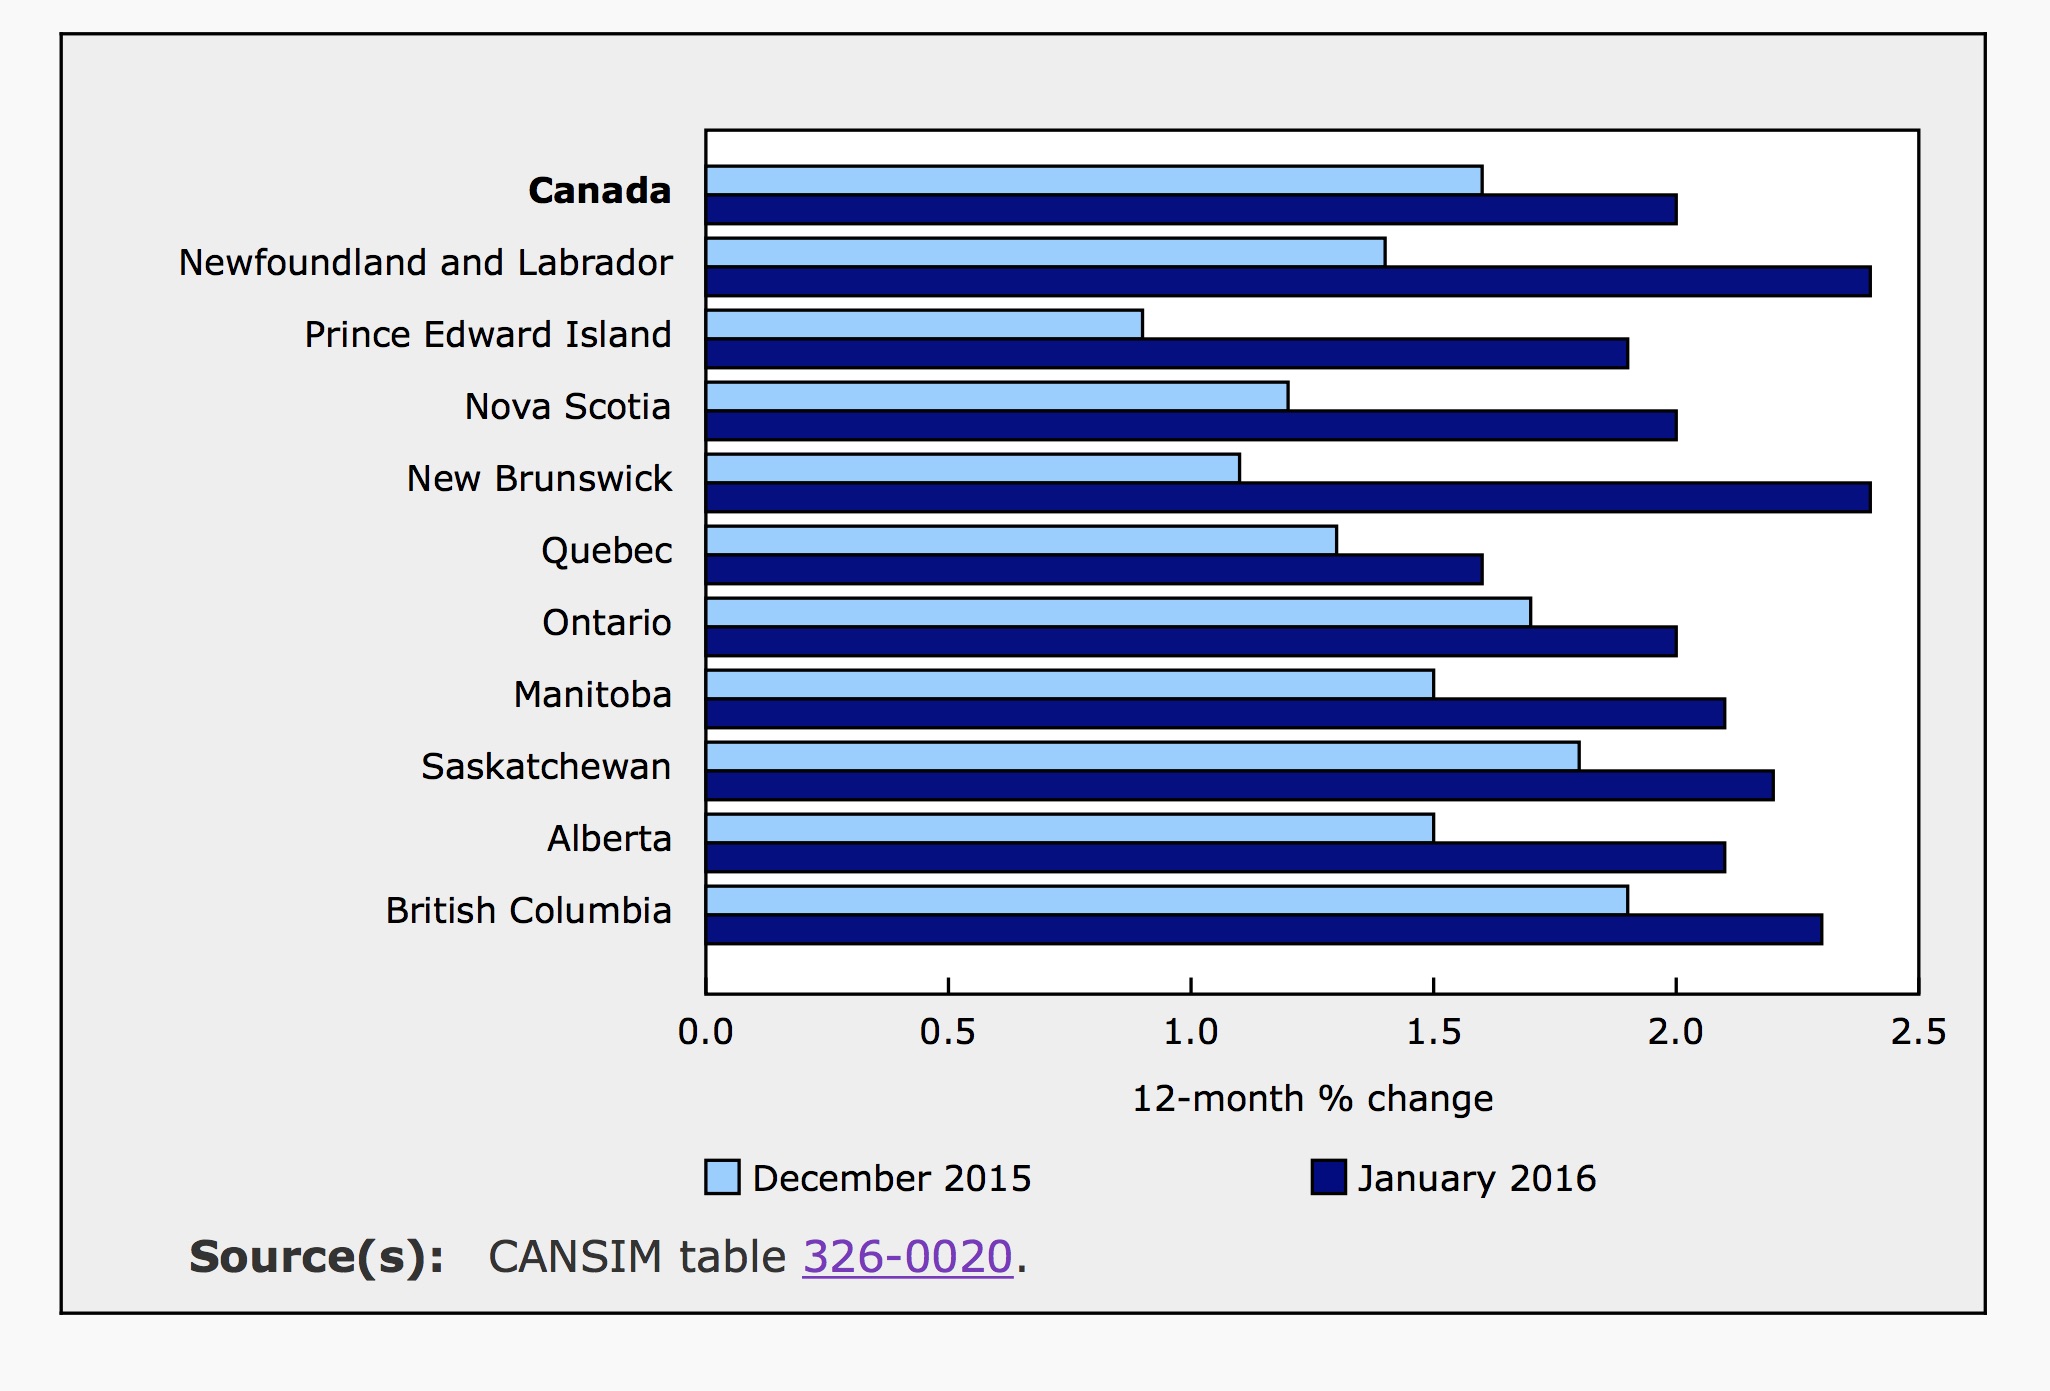
Annual inflation accelerated in every province in January versus December. New Brunswick saw the most drastic change in price levels. This was largely driven by especially higher prices for fresh fruit, vegetables and meat in that province. Fruit and vegetables prices also grew above the national average in British Columbia. In that province, the fresh vegetable index was up 26.2% for the year.
In Ontario, new regulations around electricity bills resulted in a 6.9% increase in electricity prices in January alone. Overall inflation was quelled in Quebec as insurance, vehicle registration and licensing fees, as measured by the passenger vehicle insurance premiums index fell 7.1% in January.
Economic Outlook
The Bank of Canada targets an inflation rate of 2%. While January’s CPI data is right on the mark, the factors driving price levels in Canada may be somewhat transitory. Cheap oil prices have weakened Canada’s currency, contributing to higher prices for imports, particularly food. On the other hand, cheap oil and energy costs balance the impact of higher import prices. A rebound in the price of oil (and the resulting rebound in the Loonie) would flip these factors and inflation numbers could become more volitile.
When the Bank meets in early March to review monetary policy, they are largely expect to leave interest rates unchanged. Today’s unexpectedly strong inflation data supports this expectation.

Emily is a Canadian financial blogger with multiple degrees in economics and extensive professional experience as a financial analyst. She was formerly a Ph.D. candidate at the University of Guelph's School of Agricultural Economics. Before that, she received an MA from the University of San Francisco in International Development Economics. She also has a BA in Math with a minor in Economics.