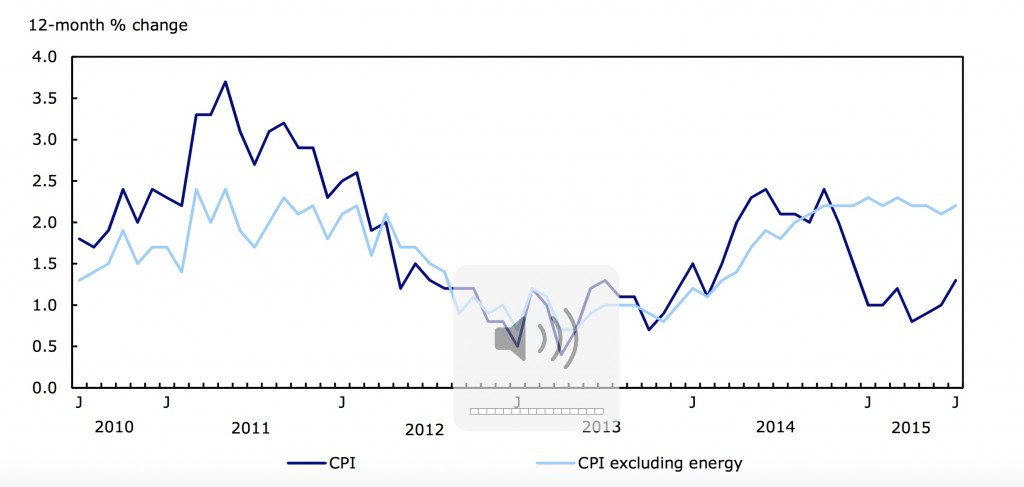
This morning Statistics Canada released inflation data for the month of July. The consumer price index climbed 0.1% for the past month, following an increase of 0.2% in June. Annual inflation appeared to strengthen as prices climbed 1.3% for year ending in July compared to an increase of 1.0% for the year ending in June. Today’s numbers are only marginally below expectations, which were 0.2 % for the month and 1.4% for the year. Core inflation, which excludes volatile items like food and energy was up 2.4% for the year ending in July following a 2.3% rise in June. This narrowly missed the consensus estimate of 2.5%.
On a seasonally adjusted basis, inflation slowed slightly in July. With seasonal adjustments, the CPI climbed 0.2% following an increase of 0.4% in June. Seasonally adjusted core inflation also slowed in July, posting an increase of 0.2% versus 0.3% for June.
Annual Inflation
Annual CPI growth was significantly stronger than it was in June despite a slow down for the month because annual numbers no longer include July 2014, a month when the CPI fell 0.2%.
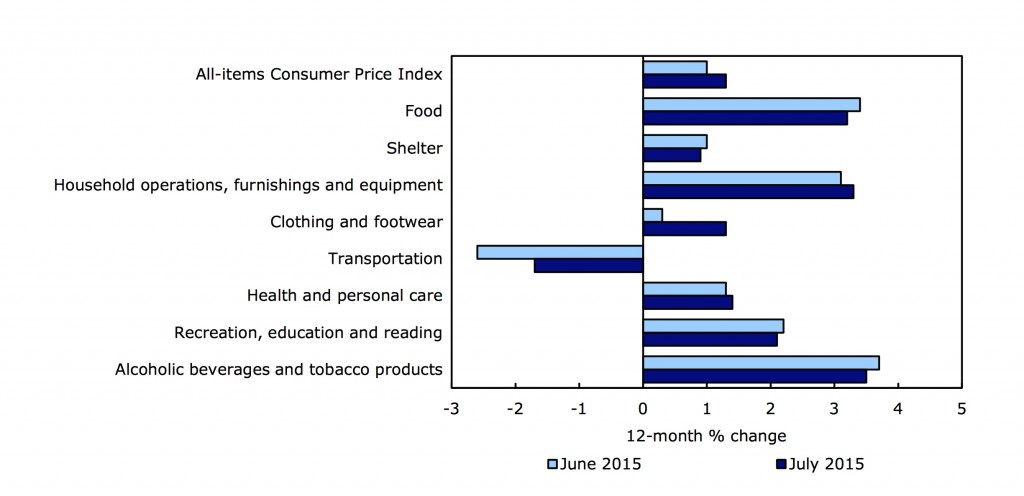
The transportation index was the only major component to post an annual decline in July. The index, which accounts for nearly 20% of the CPI fell 1.7% for the year. The impact of cheap energy and gasoline is subsiding; for the year ending in June, the transportation index was down a more significant 2.6%.
Annual declines in energy prices still had the largest drag on inflation this month. Year over year, the cost of gasoline fell 12.2%, natural gas prices declined by -10.7% and fuel oil was 17.0% cheaper.
Higher food prices continue to be a major contributor to positive annual inflation, increasing 3.2% for the year ending in July, compared to 3.4% for June. The price of meat climbed 6.1% annually and food purchased from restaurants was 2.7% more expensive.
Other factors driving inflation for the year ending in July include higher prices for vehicles, up 2.5% and electricity, up 4.4%. The prices for homeowners’ home and mortgage insurance increased by 7.5%.
A Sluggish July
The main positive contributors to July’s 0.1% inflation were electricity, up 2.4% for the month and gasoline, up 0.4%. Hotel costs rose 3.9% and the index for travel tours climbed 1.6%. Men’s clothing also posted a steep monthly increase of 2.0%. On the other hand, inflation was slowed by declining prices for passenger vehicles, down 1.7% in July. Mortgage interest costs fell 0.8%, footwear, dairy products and non-alcoholic beverages were all down as well (1.7%, 0.9% and 2.7% respectively).
Monthly numbers are more meaningful after seasonal adjustments. Seasonally adjusted monthly data for July show inflation decelerating but still positive in six of the eight major components. Clothing and footwear showed the most significant spike in prices, climbing 0.6% for the month. Transportation increased by a seasonally adjusted 0.4% in July.
| Consumer Price Index, major components – Seasonally adjusted | % Change July | % Change June | % Change May | % Change April |
| All-items (100%) | 0.2 | 0.4 | 0.4 | -0.1 |
| Food (16.41%) | 0 | 0.1 | 0.4 | 0.4 |
| Shelter (26.08%) | 0.2 | 0.2 | 0.1 | -0.2 |
| Household operations, furnishings and equipment (13.14%) | 0.1 | 0.1 | 0.2 | 0.4 |
| Clothing and footwear (6.08%) | 0.6 | 0.2 | -0.2 | -0.3 |
| Transportation (19.1%) | 0.4 | 1.3 | 0.6 | 0.1 |
| Health and personal care (4.73%) | 0.2 | 0 | 0.3 | 0.2 |
| Recreation, education and reading (10.89%) | 0 | 0.4 | 0.8 | -0.8 |
| Alcoholic beverages and tobacco products (2.86%) | 0.1 | 0.1 | 0.3 | 0.5 |
| Bank of Canada’s core index | 0.2 | 0.3 | 0.2 | 0.1 |
| All-items excluding food and energy | 0.2 | 0.2 | 0.3 | 0.1 |
| Source: CANSIM table 326-0022. |
Inflation by Province
Prices were higher in July compared to June in every province except PEI. PEI has posted declining annual CPI numbers for the past eight months. Inflation was highest in Saskatchewan at 1.9% for the year ending in July, in line with June’s numbers. The price of natural gas in Ontario became much less of a drag on the province’s annual inflation, which ticked up significantly by 1.5% following an annual increase of only 1% for June. Alberta’s natural gas index plummeted 30.7% for the year ending in July but overall Alberta’s CPI increased 1.3% for the period.
| Consumer Price Index for the provinces | % change July 2014 to July 2015 | % change June 2014 to June2015 |
| Canada (100%) | 1.3 | 1.0 |
| Ontario (38.9%) | 1.5 | 1.0 |
| Quebec (21.6%) | 1.3 | 1.0 |
| British Columbia (13.9%) | 1.0 | 0.8 |
| Alberta (13.2%) | 1.3 | 1.7 |
| Manitoba (3.2%) | 1.0 | 1.0 |
| Saskatchewan (3.0%) | 1.9 | 1.9 |
| Nova Scotia (2.5%) | 0.9 | 0.8 |
| New Brunswick (1.9%) | 1.2 | 1.0 |
| Newfoundland and Labrador (1.4%) | 0.7 | 0.6 |
| Prince Edward Island (0.3%) | -0.1 | -0.1 |
| Source: CANSIM table 326-0022 |
For the month of July, prices were higher in five out of ten province. Ontario’s CPI posted the largest increase, 0.2%. Prices in Manitoba fell by the same amount, which is the largest monthly decline by province.
Outlook for Canada’s Economy
Today’s inflation numbers did not contain any major surprises. Inflation is sluggish, as expected and the impact of high energy prices continues to fade. Economists expect inflation to hit 2%, the central bank’s target, in the first quarter of 2016, according to a Bloomberg survey conducted between August 7th and August 12th. According to the Monetary Policy Report, Canada’s GDP growth is projected to average just over 1% in 2015 and about 2.5% in 2016 and 2017.
Retail sales for June, also released this morning, were a positive surprise for the Canadian economy. Total retail sales grew 0.6% in June, well above expectations, which were only 0.3%. Statistics Canada also reported that wholesale trade bounced back in June, increasing by 1.3% following a decline in May.
At the same time, June’s first-time employment insurance claims reached their highest level since August 2009. In Alberta EI claims were up 42.3% for the year. Employment also appears to be on the decline in the non-oil dependent provinces, Ontario’s EI claims climbed 9.3% over the year ending in June.
Reacting to slowing growth in China and tumbling oil prices, Canada’s benchmark stock index fell to an 8 month low on Thursday. China’s decision to devalue it’s currency sparked similar moves in Kazakhstan and Vietnam, stirring deflationary pressures around the globe. A decline in global demand for commodities is potentially the largest threat to Canada’s economy.
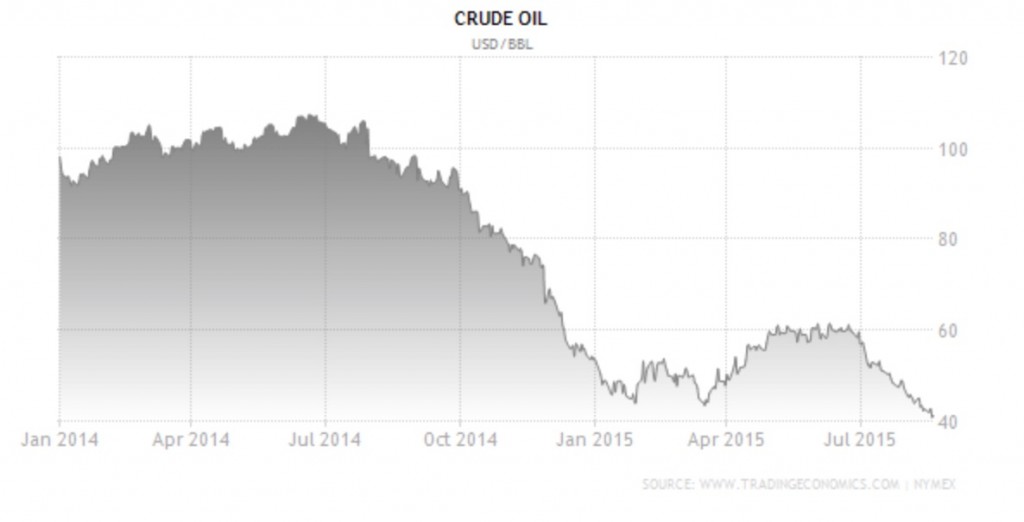
Crude Oil plummeted from around USD $58/barrel to below USD $46/barrel in the month of July alone; such prices have not been seen since 2009. Currently, crude oil is trading below USD $41/barrel. Canada’s energy producers need a USD $40/barrel price to break even and have already cut production.


