
Statistics Canada released August inflation data this morning. While the overall numbers appear muted, low energy prices mask growth in other components of the consumer price index (CPI). For the year ending in August, the CPI climbed 1.3%, the same number that was posted for the year ending in July. On a seasonally adjusted basis, the CPI was flat for the month of August after rising 0.2% in July. The Bank of Canada’s core index, which excludes volatile items such as energy and food, rose 2.1% for the year ending in August compared to 2.4% for the year ending in July. The seasonally adjusted core index rose 0.1% in August, slowing from July’s 0.2% increase.
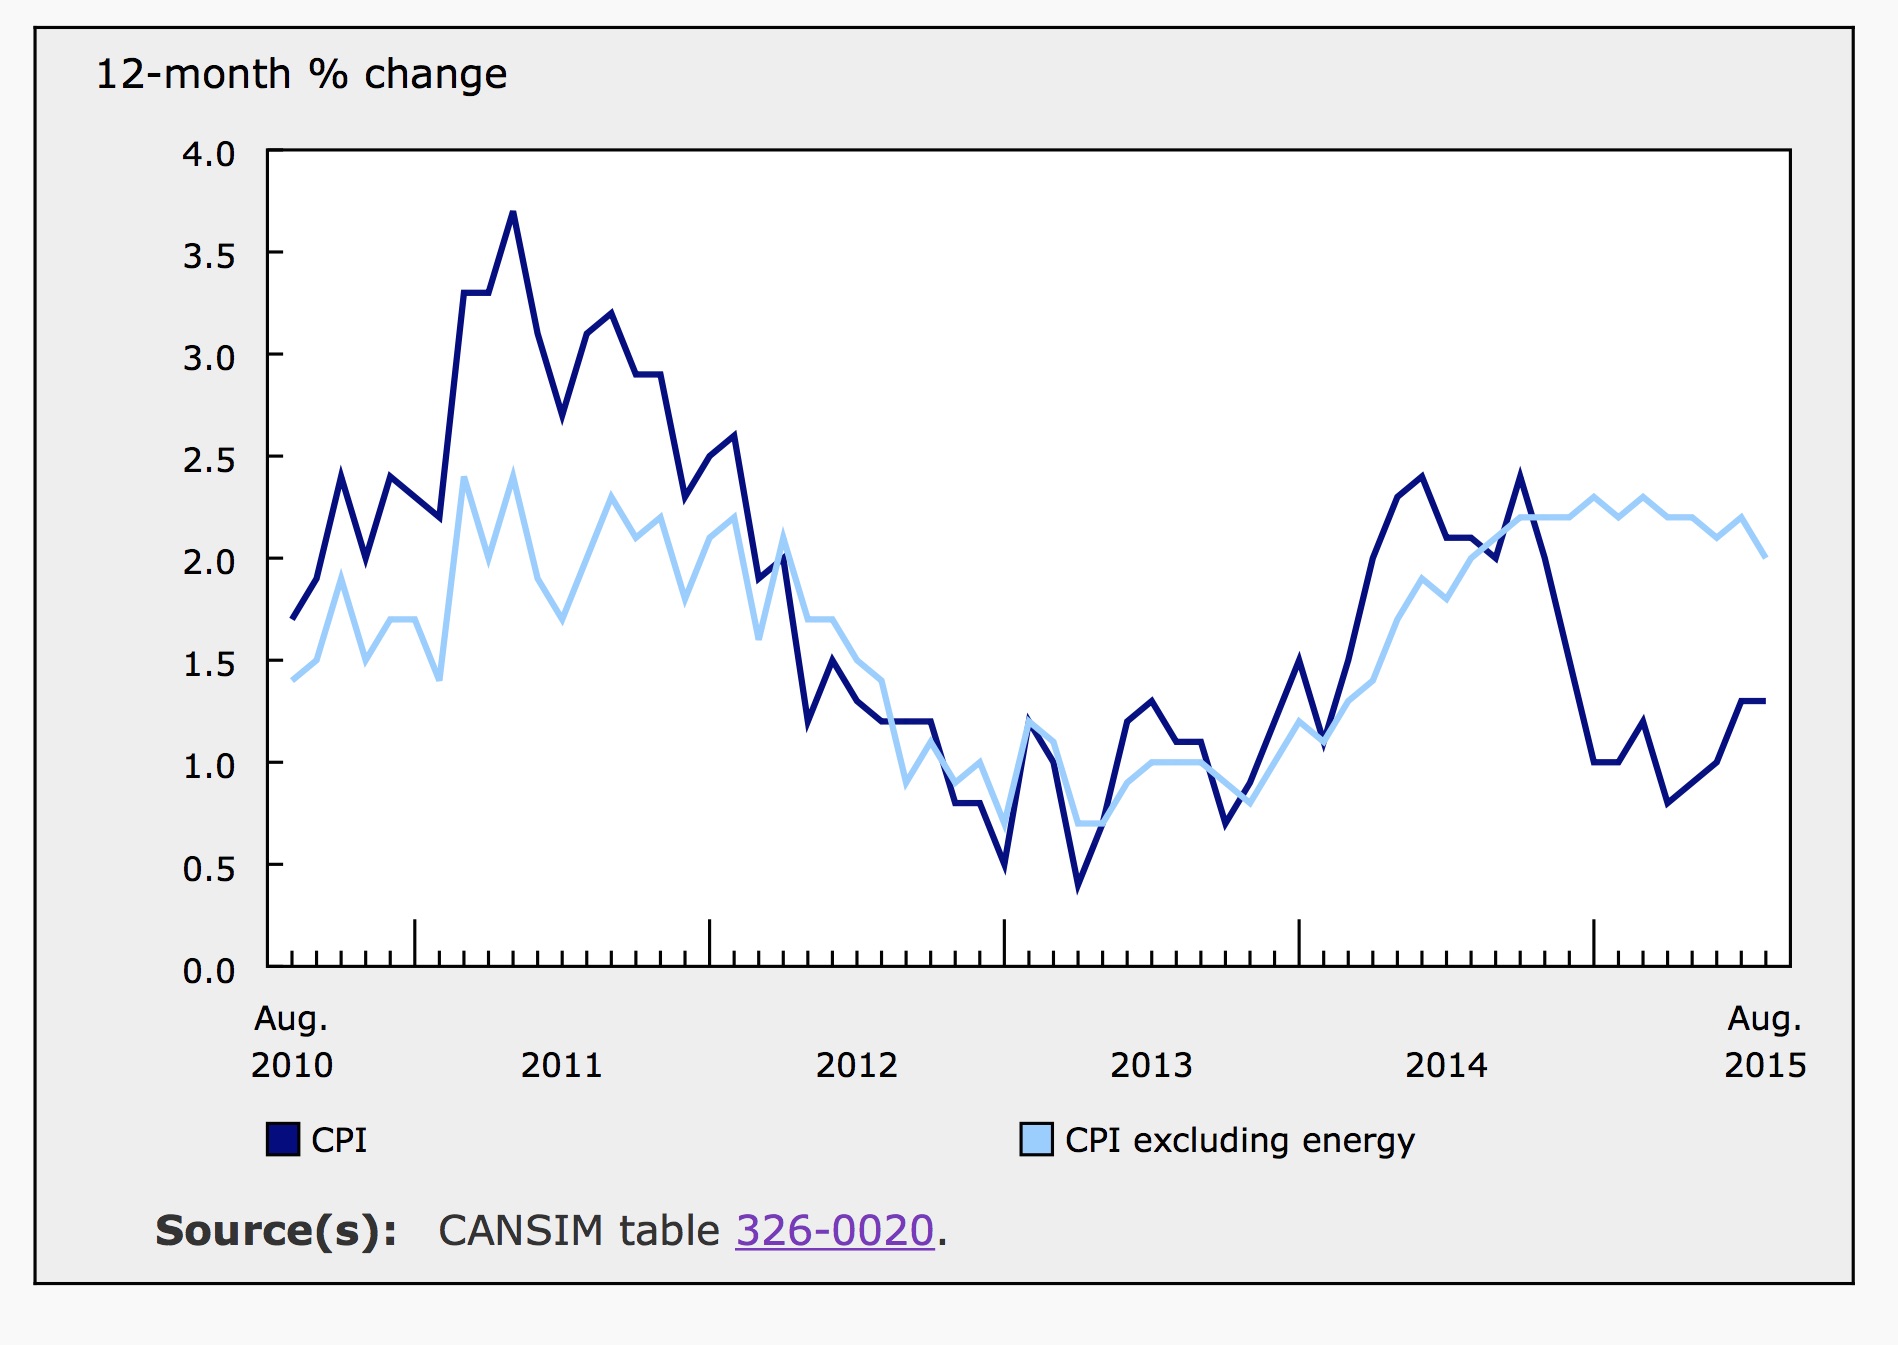
Seasonally Adjusted Monthly Inflation
Despite posting zero seasonally adjusted change in consumer prices in August, there was significant movement within the individual components of the price index. Namely, the transportation index, which has been climbing since February, fell 0.7% over the month. This was driven by a (non seasonally adjusted) 3.6% decline in the price of gas in August alone. Gas prices fell in seven provinces but were higher in Manitoba, Saskatchewan and Alberta due to problems at a U.S. refinery.
Health and personal care was the only other component to decline on a seasonally adjusted basis in August, falling 0.1% after climbing 0.2% in July. The indexes for health care goods and personal care goods were down 0.3% and 0.2% respectively. While health care services were flat and personal care services were up 0.3% in August.
The decline in the transportation index offset significant rises in both the household operations, furnishings and equipment index and the clothing and footwear index. Both rose a seasonally adjusted 0.4% in August. The household index rose because of higher prices for cleaning products, up 1.5%. Household equipment was also up 0.6%, while furniture and textile prices fell 0.7% in August. For the clothing and footwear index, a decline of 2.3% in the price of children’s clothing, was more than balanced by higher prices for men’s and women’s clothing and footwear. The price of jewelry, also part of this index, was up significantly in August (3.7%).
The price of food, a large component of CPI, was reportedly 0.2% higher in August on a seasonally adjusted basis. Without seasonal adjustments, the price of food fell 0.1% for the month, including a 0.3% decline in the price of food purchased from stores. The decline in food prices was largely driven by a 4% fall in vegetable and vegetable preparation costs. The cost of fruit was also down 1.6%, while meat and fish were slightly more expensive, climbing 0.7% and 0.5% respectively in August.
| Consumer Price Index, seasonally adjusted (Percentage Change) | ||||||||||||
|---|---|---|---|---|---|---|---|---|---|---|---|---|
| Jan-2015 | Feb-2015 | Mar-2015 | Apr-2015 | May-2015 | Jun-2015 | Jul-2015 | Aug-2015 | Sept-2015 | Oct-2015 | Nov-2015 | Dec-2015 | |
| All-items (9) | -0.2 | 0.2 | 0.3 | -0.1 | 0.4 | 0.4 | 0.2 | 0 | -0.2 | 0.2 | 0.2 | 0.1 |
| Food | 0.7 | -0.1 | 0.2 | 0.4 | 0.4 | 0.1 | 0 | 0.3 | 0.4 | 0.4 | 0.0 | 0.6 |
| Shelter | 0.1 | 0 | 0.2 | -0.2 | 0.1 | 0.2 | 0.2 | 0.1 | 0 | 0.3 | 0.1 | 0.1 |
| Household operations, furnishings and equipment | 0.1 | 0.3 | 0.3 | 0.4 | 0.2 | 0.1 | 0.2 | 0.4 | 0.1 | -0.1 | -0.6 | 0.2 |
| Clothing and footwear | 0.4 | -0.1 | 0 | -0.3 | -0.2 | 0.2 | 0.7 | 0.4 | -0.1 | 0.2 | 0.6 | -0.9 |
| Transportation | -2.3 | 0.7 | 0.6 | 0.1 | 0.6 | 1.3 | 0.4 | -0.9 | -1.4 | 0.3 | 0.8 | 0.3 |
| Health and personal care | 0.3 | 0 | -0.2 | 0.2 | 0.3 | 0 | 0.2 | -0.2 | 0.2 | 0.2 | 0.3 | -0.2 |
| Recreation, education and reading | 0.7 | 0.7 | 0.4 | -0.8 | 0.8 | 0.4 | 0 | 0.3 | 0.3 | -0.3 | -0.3 | 0.0 |
| Alcoholic beverages and tobacco products | 0.5 | 0.3 | 0.3 | 0.5 | 0.3 | 0.1 | 0.1 | 0.3 | 0.2 | 0.0 | 0.6 | -0.2 |
| All-items excluding food and energy | 0.3 | 0.1 | 0.3 | 0.1 | 0.2 | 0.2 | 0.2 | 0.1 | 0.2 | 0.0 | 0.1 | 0.1 |
| Bank of Canada's core index (11) | 0.2 | 0.1 | 0.4 | 0.1 | 0.2 | 0.3 | 0.2 | 0.2 | 0.1 | 0.2 | 0.1 | 0.1 |
| Source: Statistics Canada. Table 326-0022 - Consumer Price Index, seasonally adjusted (Percentage Change (month-to-month)) | ||||||||||||
Annual Inflation Numbers
For the year ending in August, prices were higher in every component of the CPI except transportation. The transportation index posted a decline, adding to 9 consecutive months of annual declines. August’s annual inflation was largely driven by growth in the price of food, which rose 3.6% over the 12-month period. Prices for meat, fruits and vegetables we all up significantly, 6.3%, 5.9%, 6.1% respectively. Food purchased from stores was 4% more expensive than a year earlier.
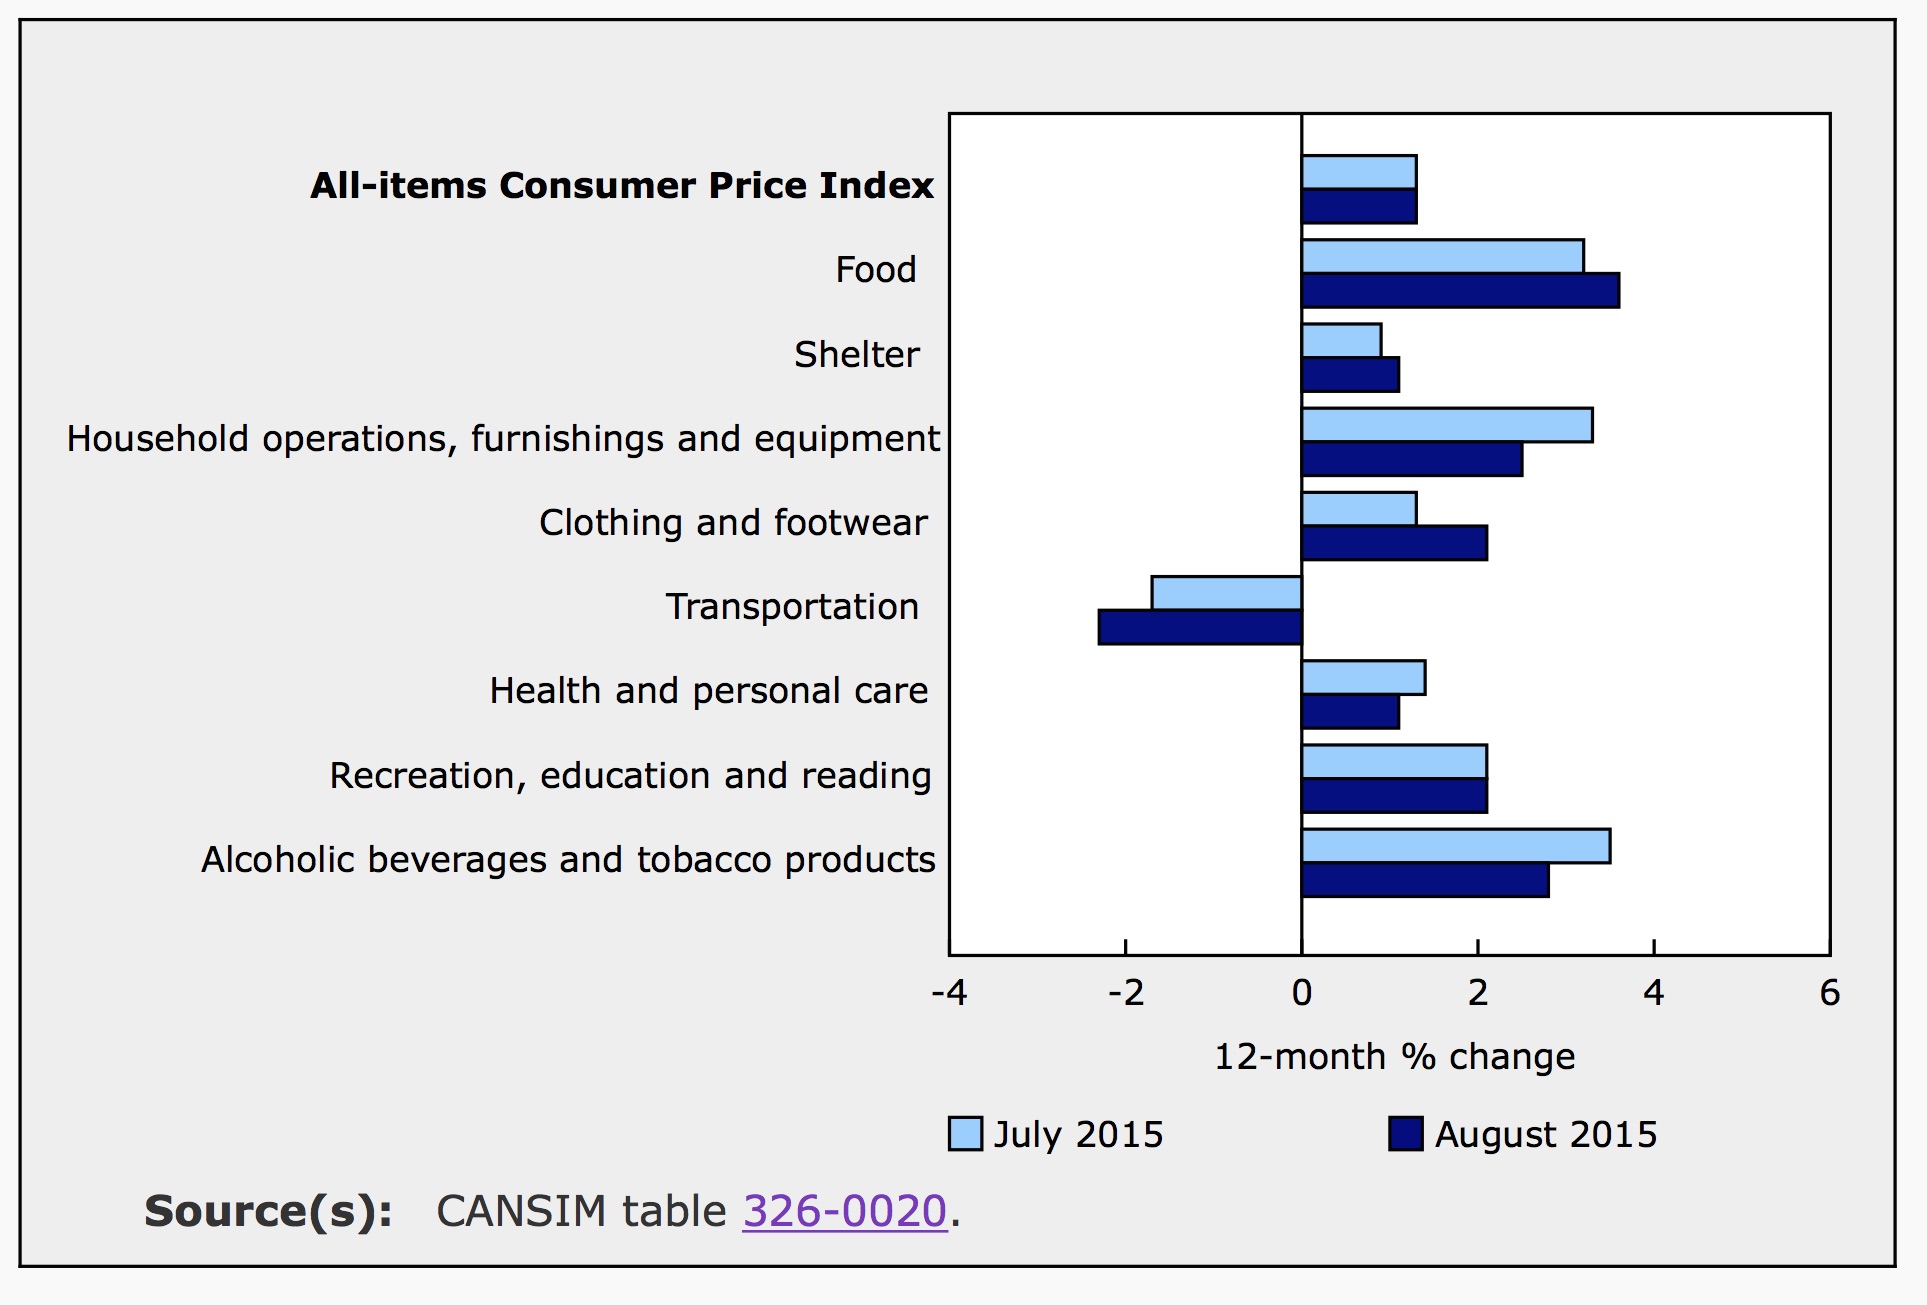
Falling energy prices were the major drag on overall inflation over the 12-month period. The transportation index was down 2.3% from August 2014, which includes a 12.6% decline in the gasoline index. The price of fuel oil and other fuels, which is included in the shelter index, fell a drastic 20.2% over the year ending in August. However, the shelter index still managed to post a year over year increase, up 1.1%. The largest reason for this growth was a spike in home and mortgage insurance costs, up 8.1% year over year.
Inflation by Province
For the month of August, prices fell in Ontario (-0.3%), Quebec (-0.1%), New Brunswick (-0.1%), Nova Scotia (-0.1%) and PEI (-0.2%). These provinces all saw gas prices falling throughout the month. The three provinces where gas prices rose, Manitoba, Saskatchewan and Alberta, all posted monthly increases in overall CPI. Manitoba posted the largest monthly inflation in August at 0.6%, following a decline of 0.2% in July. Manitoba’s monthly inflation resulted from higher prices for gas and electricity in the province.
| Consumer Price Index (Percentage Change (month-to-month)) | ||||||||||||
|---|---|---|---|---|---|---|---|---|---|---|---|---|
| Jan-2015 | Feb-2015 | Mar-2015 | Apr-2015 | May-2015 | Jun-2015 | Jul-2015 | Aug-2015 | Sept-2015 | Oct-2015 | Nov-2015 | Dec-2015 | |
| Canada | -0.2 | 0.9 | 0.7 | -0.1 | 0.6 | 0.2 | 0.1 | 0 | -0.2 | 0.1 | -0.1 | -0.5 |
| Newfoundland and Labrador | -0.5 | 1 | 1.1 | -0.5 | 1 | 0.2 | -0.1 | 0.2 | -0.3 | 0.1 | -0.3 | -0.5 |
| Prince Edward Island | -1.1 | 1.2 | 1.2 | -0.7 | 0.6 | 0.5 | -0.1 | -0.2 | -0.5 | 0.0 | 0.2 | -0.3 |
| Nova Scotia | -0.4 | 0.9 | 1.2 | -0.1 | 0.5 | 0 | -0.1 | -0.1 | -0.4 | 0.2 | -0.5 | -0.2 |
| New Brunswick | -0.8 | 0.9 | 1 | -0.5 | 1 | 0.1 | 0.1 | -0.1 | -0.5 | 0.2 | -0.1 | -0.2 |
| Quebec | -0.2 | 1.1 | 0.6 | 0 | 0.5 | -0.1 | 0.1 | -0.1 | -0.1 | 0.1 | -0.2 | -0.4 |
| Ontario | -0.1 | 0.7 | 0.7 | -0.2 | 0.6 | 0.4 | 0.2 | -0.3 | -0.2 | 0.1 | 0.0 | -0.3 |
| Manitoba | -0.2 | 0.7 | 1.1 | -0.1 | 0.2 | 0.4 | -0.2 | 0.6 | -0.3 | 0.5 | -0.2 | -1.0 |
| Saskatchewan | -0.1 | 0.9 | 0.9 | 0 | 0.5 | 0.3 | -0.1 | 0.2 | -0.5 | 0.5 | 0.0 | -0.8 |
| Alberta | -0.4 | 0.8 | 0.8 | 0.1 | 0.4 | 0.7 | 0.1 | 0.3 | -0.3 | 0.4 | -0.3 | -0.9 |
| British Columbia | -0.1 | 0.8 | 0.8 | -0.2 | 0.8 | 0.1 | 0.1 | 0.2 | 0 | -0.3 | 0.2 | -0.3 |
| Whitehorse, Yukon [6001009] (13) | -1.1 | 0.2 | 0.7 | 0.4 | 0.7 | 0.6 | 0.2 | 0.5 | -0.3 | -0.9 | -0.4 | 1.0 |
| Yellowknife, Northwest Territories [6106023] (13) | -0.5 | 0.2 | 0.8 | 0.3 | 0.6 | 0.6 | -0.1 | 0.2 | -0.3 | 0.3 | -0.5 | -0.3 |
| Iqaluit, Nunavut | 0.3 | 0.6 | 0.2 | 0.8 | 0.3 | 0.5 | 0.2 | 0.1 | 0.3 | -0.5 | -0.1 | -0.2 |
| Source: Statistics Canada. Table 326-0020 - Consumer Price Index (Percentage Change (month-to-month)) |
For the year ending in August, PEI was the only province to post a decline in prices marking its ninth consecutive month of annual declines. On the other side of the scale, Saskatchewan had the highest annual inflation as of August, up 1.9%. Manitoba was close behind, posting 1.8% CPI growth for the year.
Outlook for Canada’s Economy
With inflation stagnating south of the border and turbulence in the emerging markets, the Federal Reserve announced this week that they will postponed raising interest rates. However, we do know that the U.S. will start raising rates eventually, probably this year. This will further weaken the Canadian dollar.
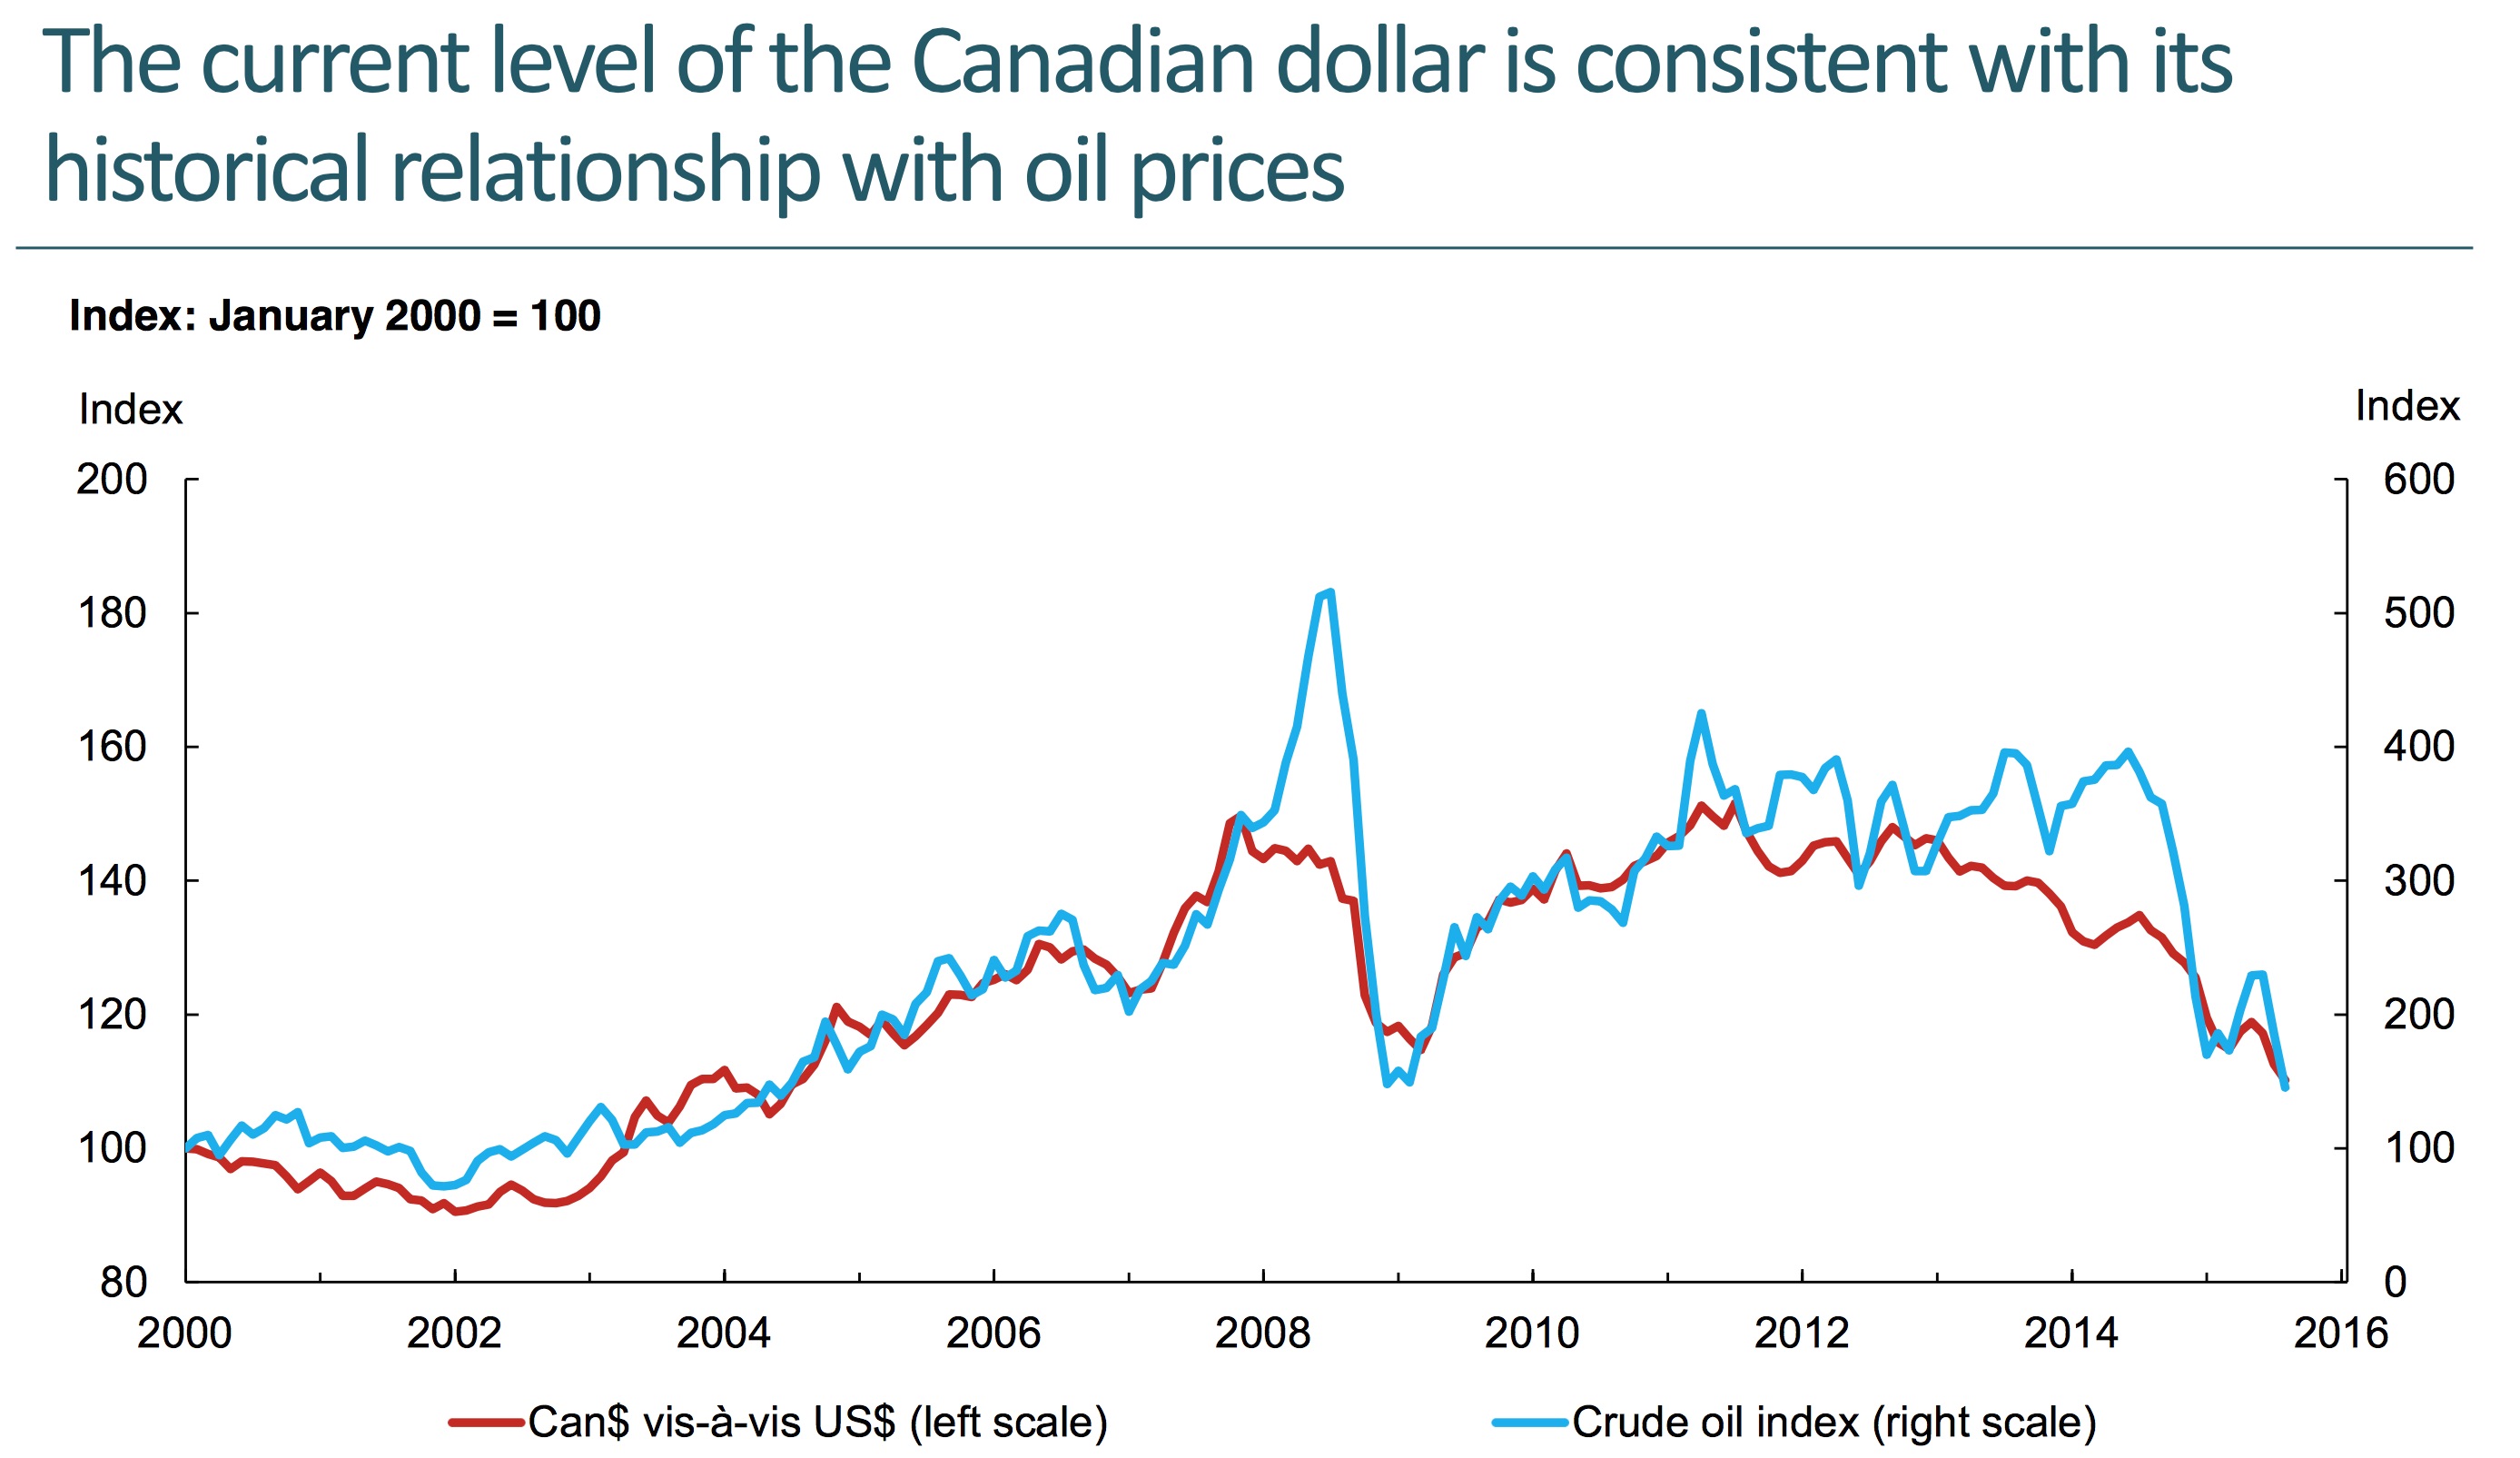
Despite Canada’s lack of GDP growth and dip into recession earlier this year, The Bank of Canada expects a recovery in the second half of the year and is banking on a cheap Loonie. The recovery is expected to be led by the export sectors, which are already seeing growth as Canada’s currency deflates. The Loonie’s value is largely a function of oil prices. The graph below is from the Bank of Canada’s September 16th press release.
Canada’s real GDP rose in June for the first time in six months driven largely by growth in mining and oil and gas extraction. July factory sales climbed 1.7% beating expectations by a healthy margin and driven by growth in car and food manufacturing. The flip side of cheap oil and a deflated Loonie is expensive imports, which will drive prices up at home, moving us towards the Bank’s 2% target inflation rate. Markets are predicting that the Bank of Canada will leave rates at 0.5% in October as the economy recovers.

Emily is a Canadian financial blogger with multiple degrees in economics and extensive professional experience as a financial analyst. She was formerly a Ph.D. candidate at the University of Guelph's School of Agricultural Economics. Before that, she received an MA from the University of San Francisco in International Development Economics. She also has a BA in Math with a minor in Economics.