This table shows the Monthly All-Items Consumer Price Index (CPI-U) and Annual Inflation Rates for Newfoundland in 2019. You can find upcoming CPI release dates on our schedule page. These numbers are released by Statistics Canada.
| Month | CPI | Monthly Inflation Rate | Yearly Inflation Rate |
|---|---|---|---|
| January 2020 | 140 | 0.3 | 2.2 |
| February 2020 | 140.3 | 0.2 | 1.7 |
| March 2020 | 139.2 | -0.8 | 0.1 |
| April 2020 | 137.6 | -1.1 | -1.5 |
| May 2020 | 138.2 | 0.4 | -1.3 |
| June 2020 | 139.5 | 0.9 | 0.1 |
| July 2020 | 139.6 | 0.1 | -0.4 |
| August 2020 | 139.1 | -0.4 | -0.6 |
| September 2020 | 139.4 | 0.2 | 0.3 |
| October 2020 | 140.5 | 0.8 | 0.6 |
| November 2020 | 141 | 0.4 | 0.8 |
| December 2020 | 140.4 | -0.4 | 0.6 |
| ANNUAL | 139.566666666667 | 0.06 | 0.12 |
Annual Inflation Rate: 0.82%
What is the relation between CPI and Inflation Rate?
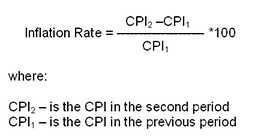
The Consumer Price Index (CPI) is used to measure Inflation rates. The formula is as follows:

CPI2 = Consumer Price Index of the second period
CPI1 = Consumer Price Index of the initial period
Notice an error in these tables?
We do our best to ensure the data is accurate and up to date. However, if one of these numbers seem wrong, please contact us and we will fix it as quickly as possible. Keep in mind that we extract the Consumer Price Index and Inflation Rates on a monthly basis from Statistics Canada’s databases.


