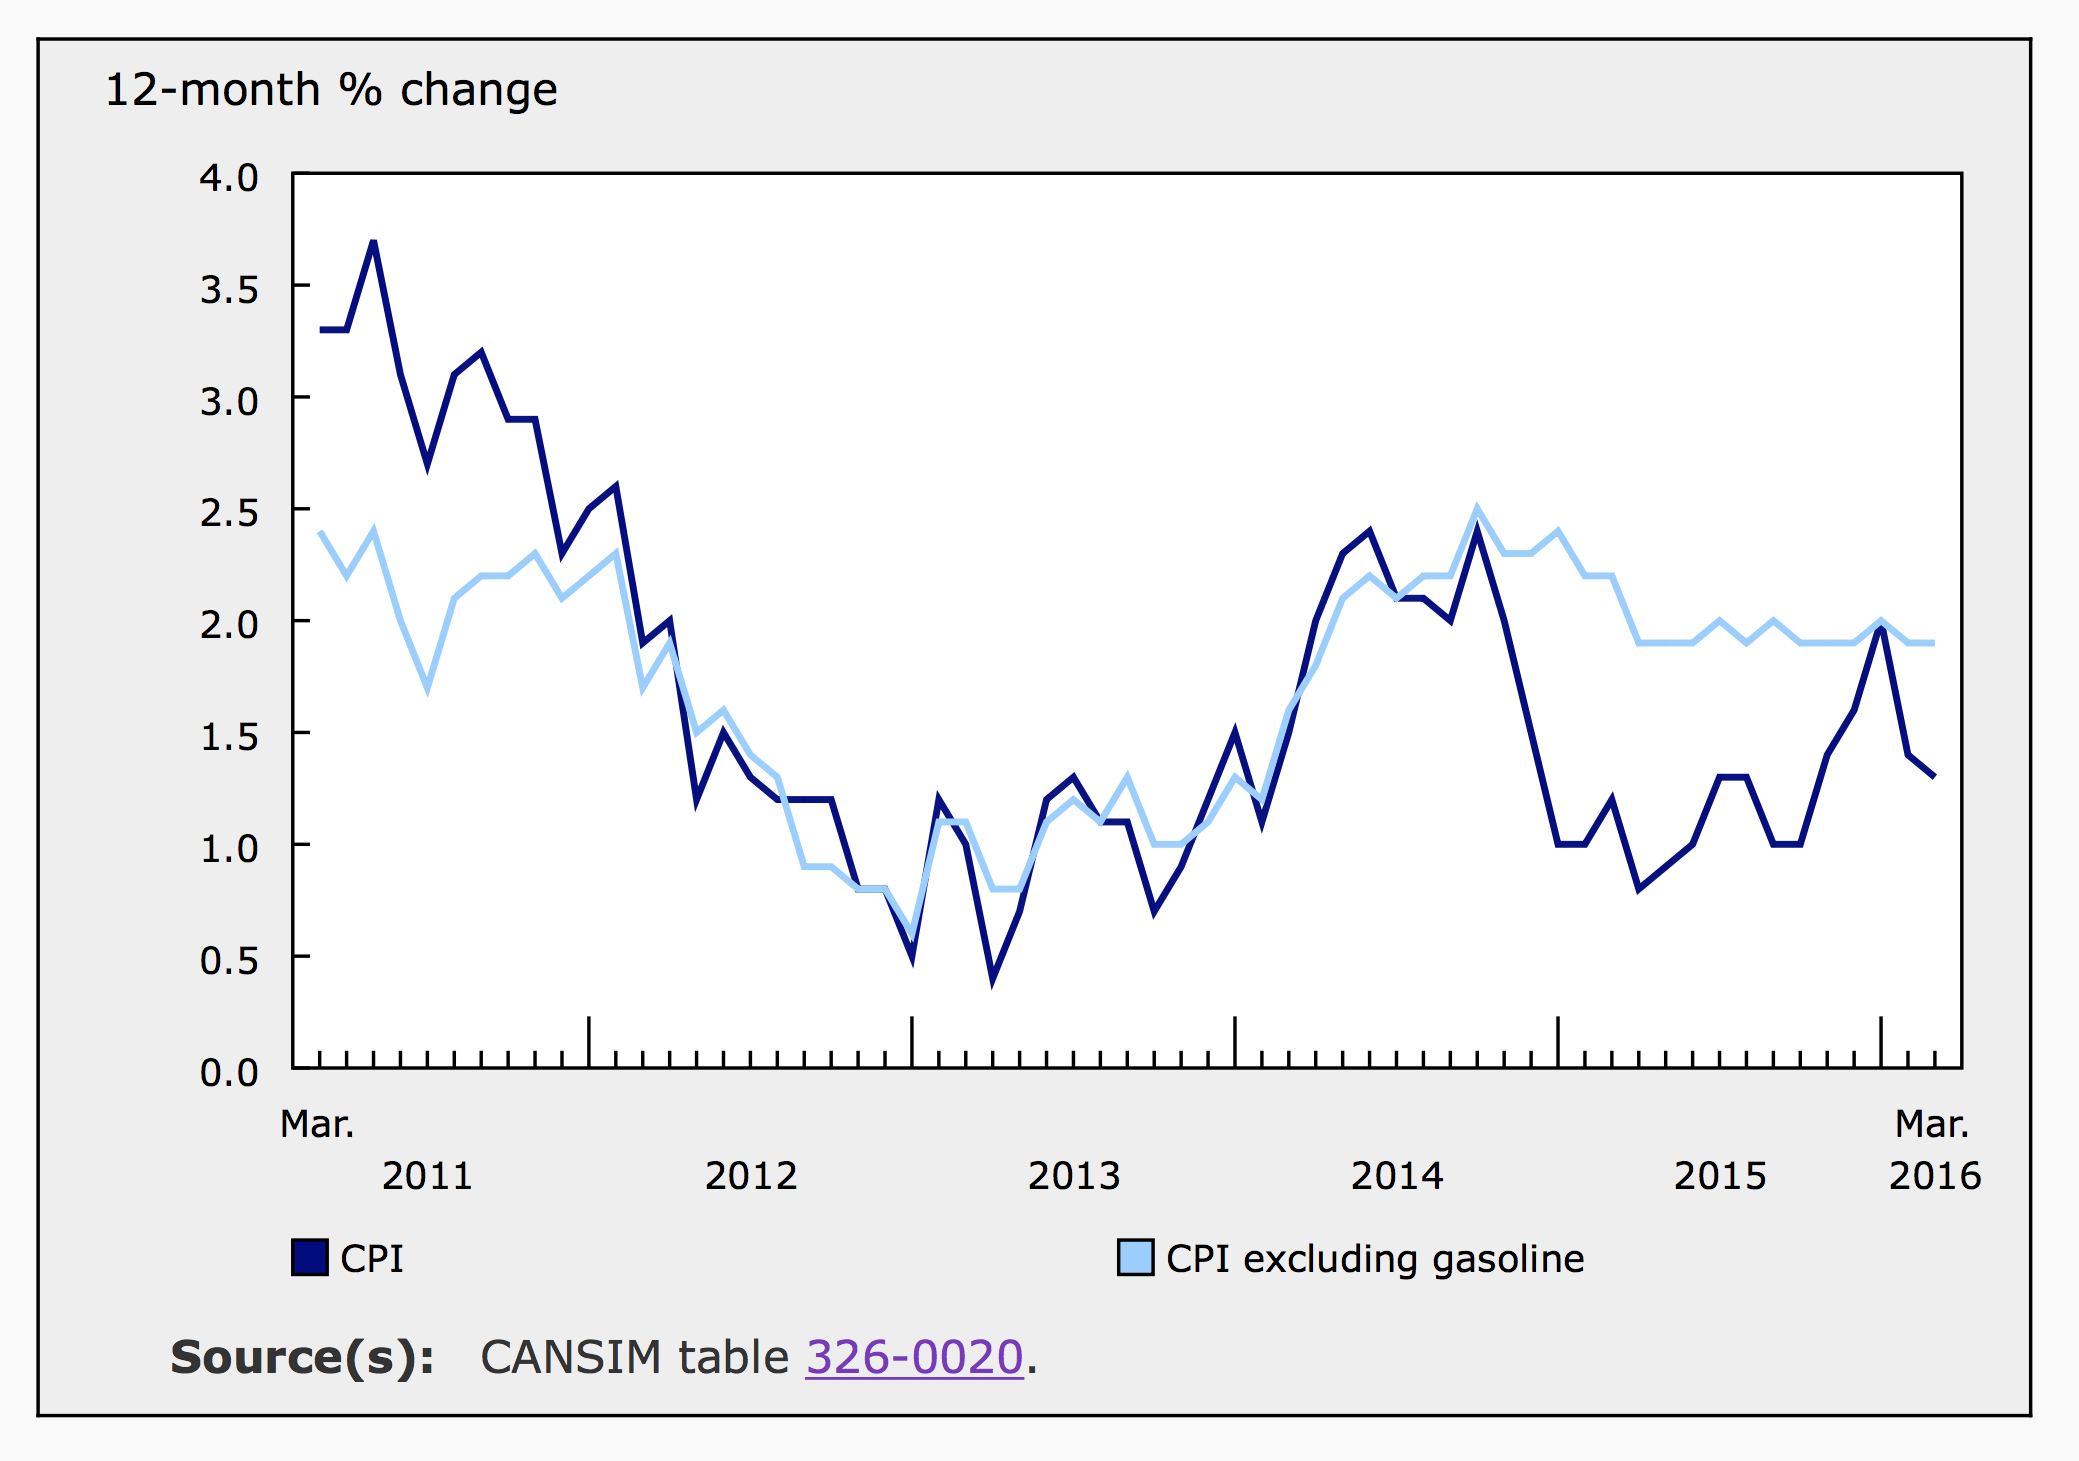
According to Statistics Canada, annual inflation slowed to 1.3% in March from 1.4% in February. Although, inflation remains well below the Bank of Canada’s 2% target, monthly data and measures of core inflation suggest there is underlying pressure on prices within the Canadian economy. Analysts had only expected inflation of 1.2% in March.
The Consumer Price Index (CPI) climbed 0.6% in March, the highest monthly number recorded in nearly a year. In both January and February, the CPI gained only 0.2%. In March of 2015, prices were up 0.7%.
The Bank’s core index excludes volatile items such as fresh produce, gasoline and other fuels and is considered a more appropriate indicator of underlying price trends. The core index accelerated in March, up 0.7% for the month and 2.1% for the year. In February core inflation ws 0.5% for the month and 1.9% for the year.
Prices in March
For the month, growth in overall price levels was largely attributable to higher gas prices (+5.7%). The food index fell 0.3% in March after rising by that amount in February. The index for meat was 2% higher in March, which slightly offset declining prices for fresh fruits (-4.5%) and vegetables (-3.3%) within the food index. Eliminating food and energy, seasonally adjusted core prices were 0.3% higher in March, accelerating from 0.2% in February.
The index for health and personal care slipped 0.1% while the index for clothing and footwear spiked 4.5%. The cost of women’s clothing was up 6.4% in March while the price of children’s footwear increased by 7.4%.
Shelter is the largest component of the CPI, accounting for 26.8% of the index. The cost of shelter ticked up by 0.1% for the fifth consecutive month in March. Within the shelter index, the index for rent was unchanged. The index for water, fuel and electricity was down 0.1%. Water prices were flat for the second consecutive month and natural gas was 1.9% cheaper after jumping 2.4% in February.
With seasonal adjustments, overall price levels were up 0.2% in March, eliminating a decline of the same amount in February. Every component of the CPI was higher after seasonal adjustments. Prices grew the most in the indexes for clothing and footwear (+0.5%), recreation and reading (+0.5%) and alcohol and tobacco products (+0.6%). The transportation index recorded higher prices (+0.2) following two monthly declines.
| January | February | March | April | May | June | |
|---|---|---|---|---|---|---|
| All Items | 0.2 | -0.2 | 0.2 | 0.2 | 0.2 | 0.2 |
| Food | 0.6 | 0.1 | 0.1 | -0.3 | -0.5 | -0.3 |
| Shelter | 0.1 | 0.1 | 0.1 | 0.1 | 0.1 | 0.4 |
| Household operations, furnishings and equipment | 0.3 | 0.3 | 0.1 | 0.2 | 0.3 | 0.1 |
| Clothing and footwear | -0.5 | -0.5 | 0.5 | 0.2 | 0.6 | 0.3 |
| Transportation | -0.9 | -1.2 | 0.2 | 1.7 | 0.6 | 0.9 |
| Health and personal care | 0.2 | 0 | 0.3 | 0.2 | 0.0 | 0.1 |
| Recreation, education and reading | 0.5 | 0.3 | 0.5 | -0.1 | 0.1 | 0.1 |
| Alcoholic beverages and tobacco products | 0.7 | 0.5 | 0.6 | 0.2 | 0.2 | -0.1 |
Annual Inflation
Price levels were higher in six of the eight major components of the CPI for the year ending in March. Growth in the indexes for food and for household operations, furnishings and equipment contributed the most to the overall rate of inflation. While a 1% decline in the transportation index weighed on overall inflation numbers.
Food accounts for 16.4% of the price index and was up 3.6% in March compared to 3.9% in February. The index for food purchased from restaurants was 2.4% higher while the index for food purchased from stores was up 4% over the 12-month period. The index for household furnishings and equipment grew by 2.7% in March.
Overall shelter costs were 1.1% higher for the year as falling prices for water, fuel and electricity (-0.8%) offset higher accommodation costs. The index for rental accommodation was up 0.8% and owned accommodation was 1.7% higher.
Excluding gasoline, the CPI was 1.9% higher in March, in line with February’s number. The gasoline index dropped 13.6% year over year, more than the 13.1% decline in February. The energy index, which includes electricity, natural gas, fuel oil and other fuels, gas and parts and accessories for vehicles, fell 7.8% in March.
Inflation By Province
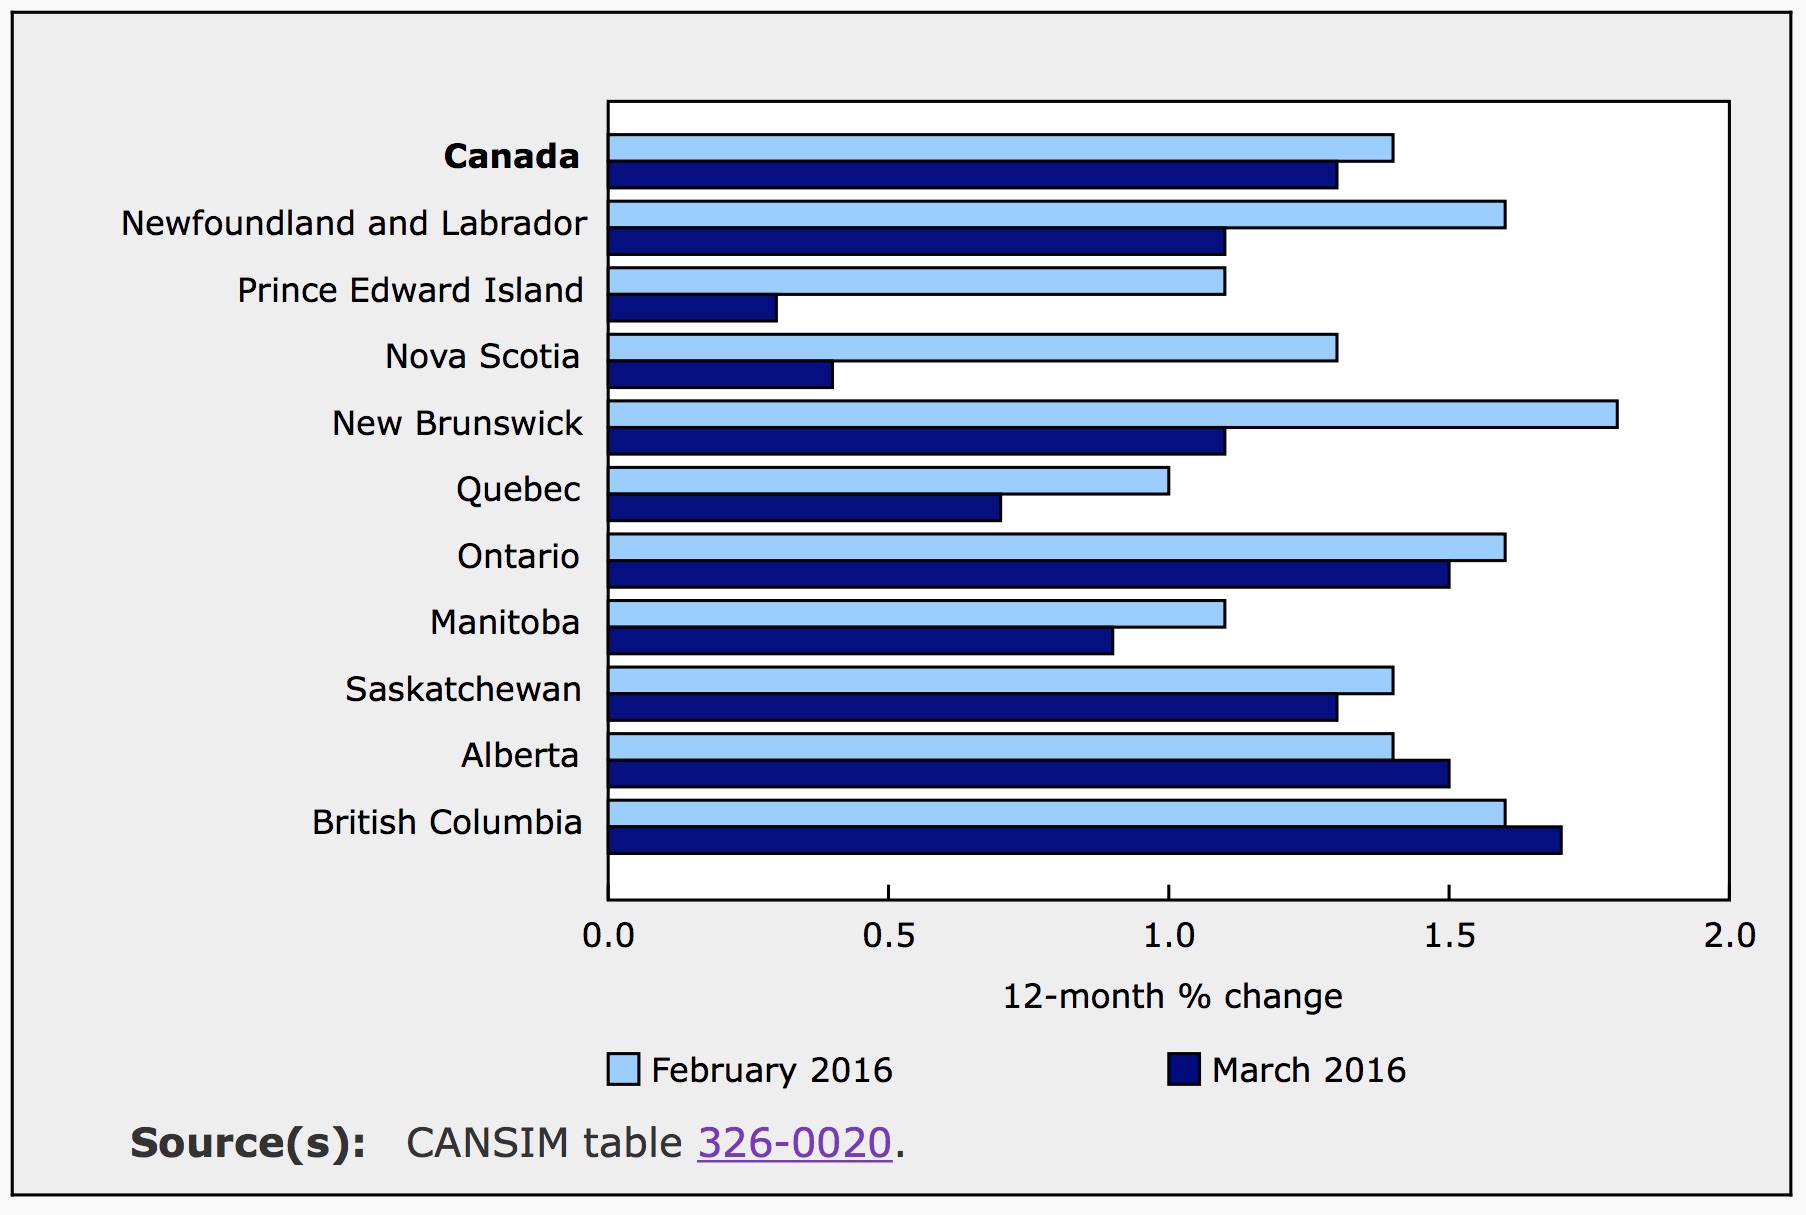
Prices were higher in every province for the year ending in March. When compared to February, inflation only accelerated in Alberta and British Columbia and slowed in the rest of the country. The slow down was most drastic in the maritime provinces where gasoline and fuel account for a larger share of consumer spending. Also, the index for gas and other fuels fell more in the eastern provinces over the year. For example, gas prices were down 18.7% year over year in Nova Scotia compared to the national average decline of 13.6%. Over the same period, gasoline prices remained higher in the prairies. In Alberta, the index for gasoline only fell by 9.9%.
Outlook
Although inflation remains below the Bank’s target rate, there are clearly indicators of underlying price pressure in the economy when the turmoil from cheap oil is eliminated. The CPI excluding gasoline is trending very close to the Bank’s 2% target. Other indicators, such as today’s retail sales report suggest the economy is fundamentally improving.
Last week the Bank of Canada left the key policy rate unchanged at 0.5% and increased their forecasted growth for 2016 from 1.4% to 1.7%.


