
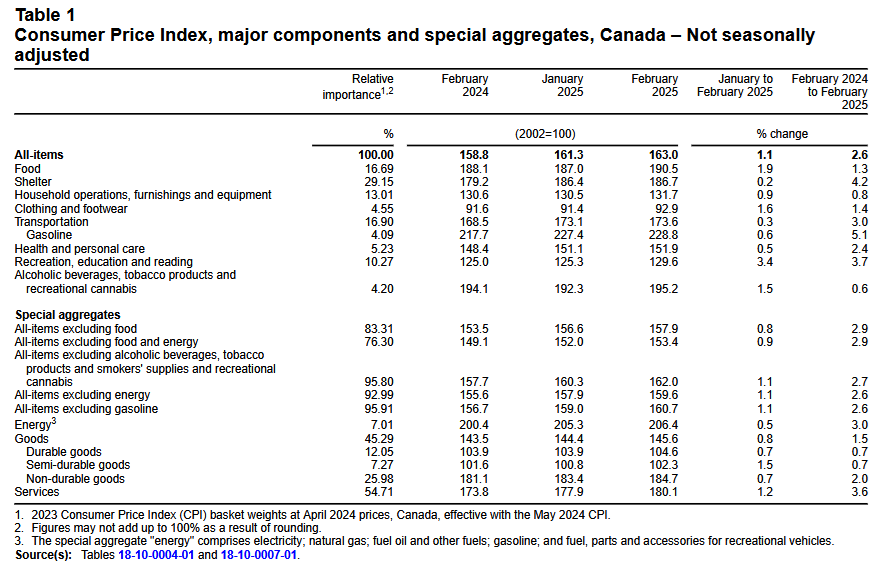
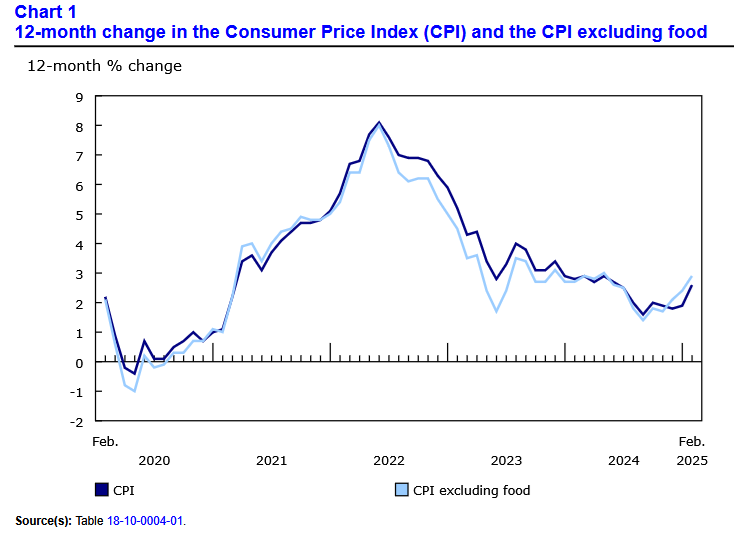
Canada’s consumer price index (CPI) increased by 2.6% year over year (Y-o-Y) in February, a noticeable rise from 1.9% in January and 1.8% in December. Statistics Canada (StatsCan) published the data at 8:30 a.m. ET on March 18, 2025, via The Daily report. On a monthly basis, the CPI rose by 1.1%, as “the end of the goods and services tax (GST)/harmonized sales tax (HST) break partway through the month contributed notable upward pressure to prices for eligible products.”
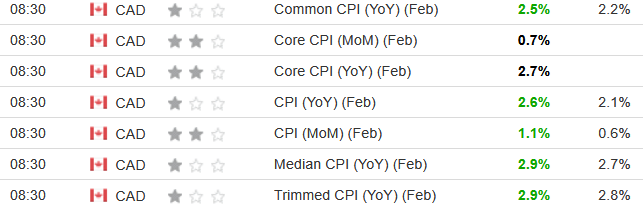
Despite the tax reversal implications, most metrics surpassed economists’ consensus estimates by a meaningful margin. The table below is courtesy of Investing.com. The left column represents February’s figures, while the right column represents forecasters’ expectations. As you can see, there was plenty of green.
Yet, with the tariff drama creating monetary policy headaches for the Bank of Canada (BoC), it cut interest rates by 25 basis points on Mar. 12. The release stated:
“Economic growth in the first quarter of 2025 will likely slow as the intensifying trade conflict weighs on sentiment and activity. Recent surveys suggest a sharp drop in consumer confidence and a slowdown in business spending as companies postpone or cancel investments.”
Although, “Canada’s economy grew by 2.6% in the fourth quarter of 2024 following upwardly revised growth of 2.2% in the third quarter. This growth path is stronger than was expected at the time of the January Monetary Policy Report.”
As a result, while realized growth has outperformed, an uncertain future outlook has led the BoC to take a cautious approach.
In February 2025, the CPI acceleration was broad-based, and the end of the tax holiday accelerated food-away-from-home inflation, as “restaurant food prices contributed the most to the acceleration in the all-items CPI in February.”
Core CPI Rises in February 2025
Core measures of the CPI jumped in February 2025, with the CPI-common index increasing to +2.5% (from + 2.2%), the CPI-median to +2.9% (from +2.7%), and the CPI-trim to +2.9% (from +2.7%). These measures exclude the impacts of food and energy, and the BoC places heavy emphasis on core measures because they provide a smoothed distribution of overall inflation.
Please note that food and energy prices are highly volatile and price spikes can occur for reasons outside of the BoC’s control. In contrast, core inflation is largely driven by consumer demand and gives the BoC a better sense of how the Canadian economy is functioning.
Sector Strength
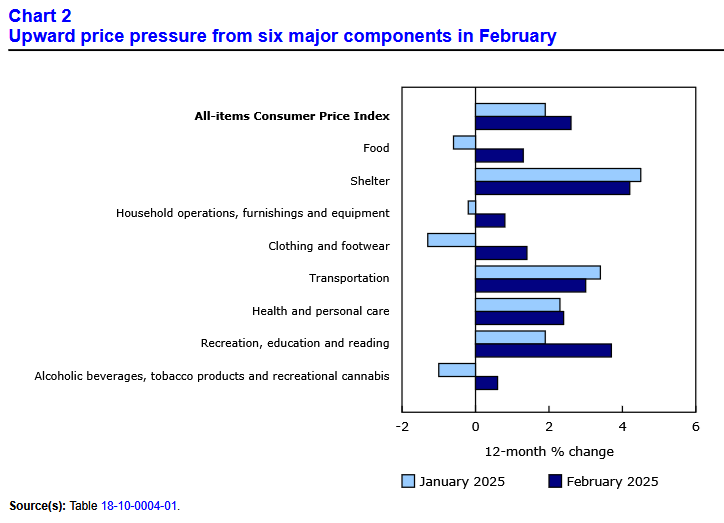
Six of the major sectors recorded Y-o-Y price increases in February, with only shelter and transportation costs receding from January.
For context, the eight sectors include food, shelter, household operations, furnishings and equipment, clothing and footwear, transportation, health and personal care items, recreation and education expenses, and alcohol and tobacco products.
Grocery Deflation Reverses
After declining by 0.5% in January and recording its first Y-o-Y drop since May 2017, food inflation rose by 1.1% in February. The upward pressure may continue if tariffs on agricultural products are passed through by farmers in the months ahead.
A Silent Recovery
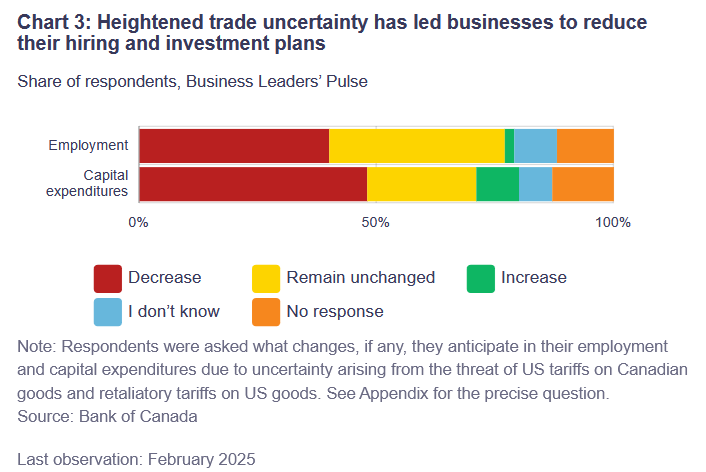
While the tariff threats garner most of the attention, the Canadian economy has quietly awoken from its slumber. When analyzing the bad, BoC Governor Tiff Macklem said on Mar. 12, “While it is too early to see much impact of new tariffs on economic activity, our surveys suggest that threats of new tariffs and uncertainty about the Canada-US trade relationship are already having a big impact on business and consumer intentions….
“Canadians are more worried about their job security and financial health as a result of the trade tensions, and they intend to spend more cautiously,” while “businesses have lowered their sales outlooks, notably in manufacturing and in sectors that depend on discretionary spending by households.”
Consequently, the BoC expects subdued economic output until the tariff clouds dissipate.
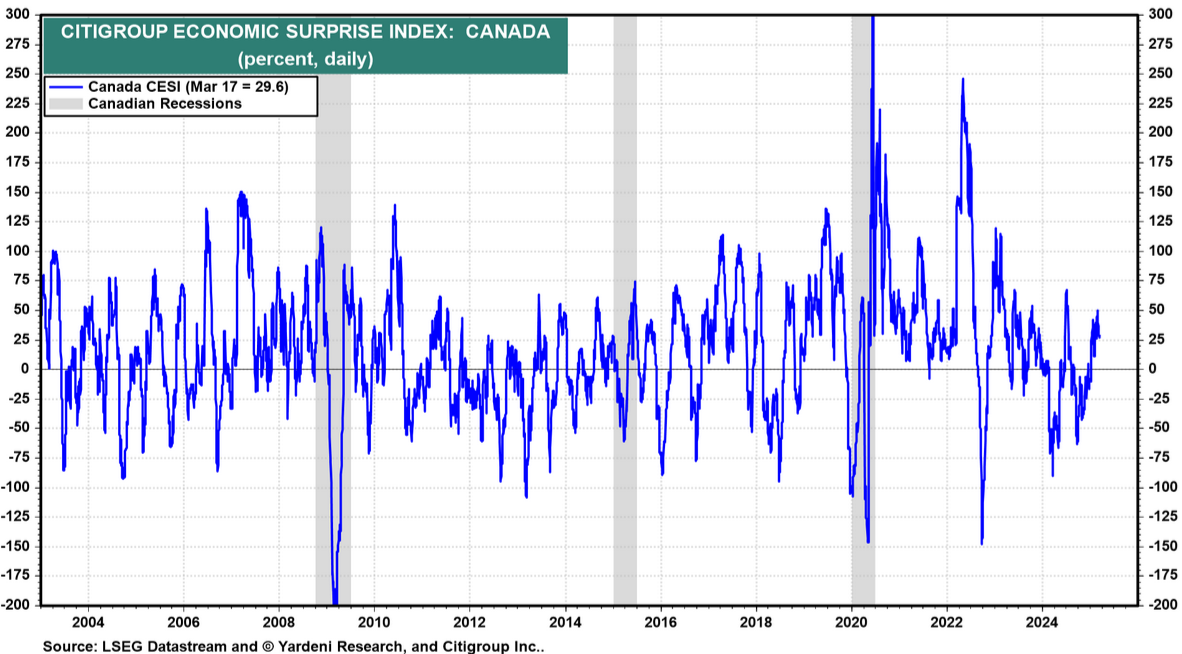
On the flip side, Canadian economic data has remained resilient despite the tariff headwinds. The chart below highlights how Canada’s Economic Surprise Index hit 29.6 on Mar. 17. For context, a positive surprise occurs when an economic data point outperforms economists’ consensus estimate. And with the metric well above zero, it depicts how Canada’s economic data has been much better than feared.
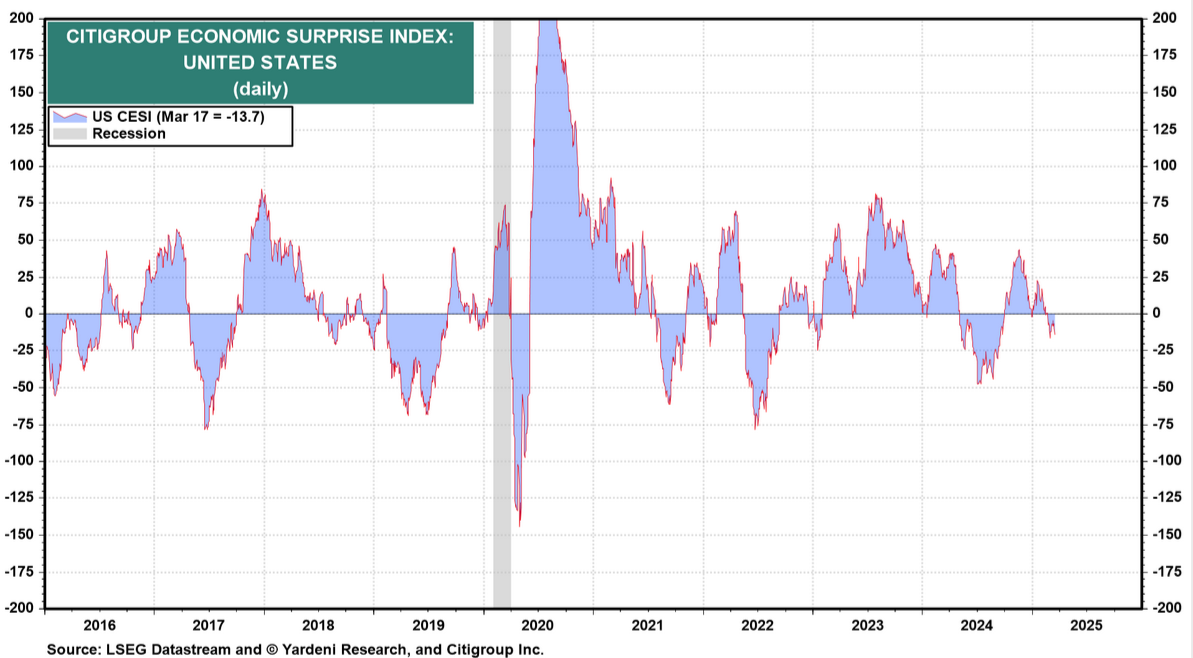
Conversely, the U.S. Economic Surprise Index sunk to -13.7 on Mar. 17, as it underperforms alongside weak economic data. Thus, the relative outlook in Canada may be brighter than it seems.
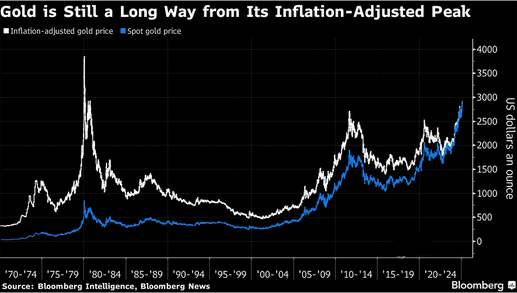
Throughout all the back and forth, the one constant has been the continued rally in gold. The yellow metal keeps hitting new record highs, and trade wars, geopolitical conflict, and accelerating inflation are bullish for precious metals. Moreover, when adjusted for inflation, Bloomberg noted that gold could trade closer to $4,000 if it reaches its historical peak.
On top of that, precious metals assets such as gold and silver have typically held their value more reliably than stocks during periods of high inflation and global uncertainty. In today’s polarised environment, physical assets and commodities such as real estate and precious metals may provide a strategic hedge.
Dedicating a small portion of one’s TFSA or RRSP portfolio to precious metals may help mitigate some of the negative effects of inflation. If you want to get started with investing in metals such as gold and silver, read our free guide to gold buying in Canada in 2024 today.

Alex Demolitor is a financial writer hailing from Halifax. Alex has a Bachelors Degree from King's College and passed the CFA Exam Level III. He specializes in fundamental analysis of the stock, bond, commodity, and FX markets. He also covers US & Canadian economic indicators. He has been published on many financial publications, including Investing.com, FXEmpire and others.