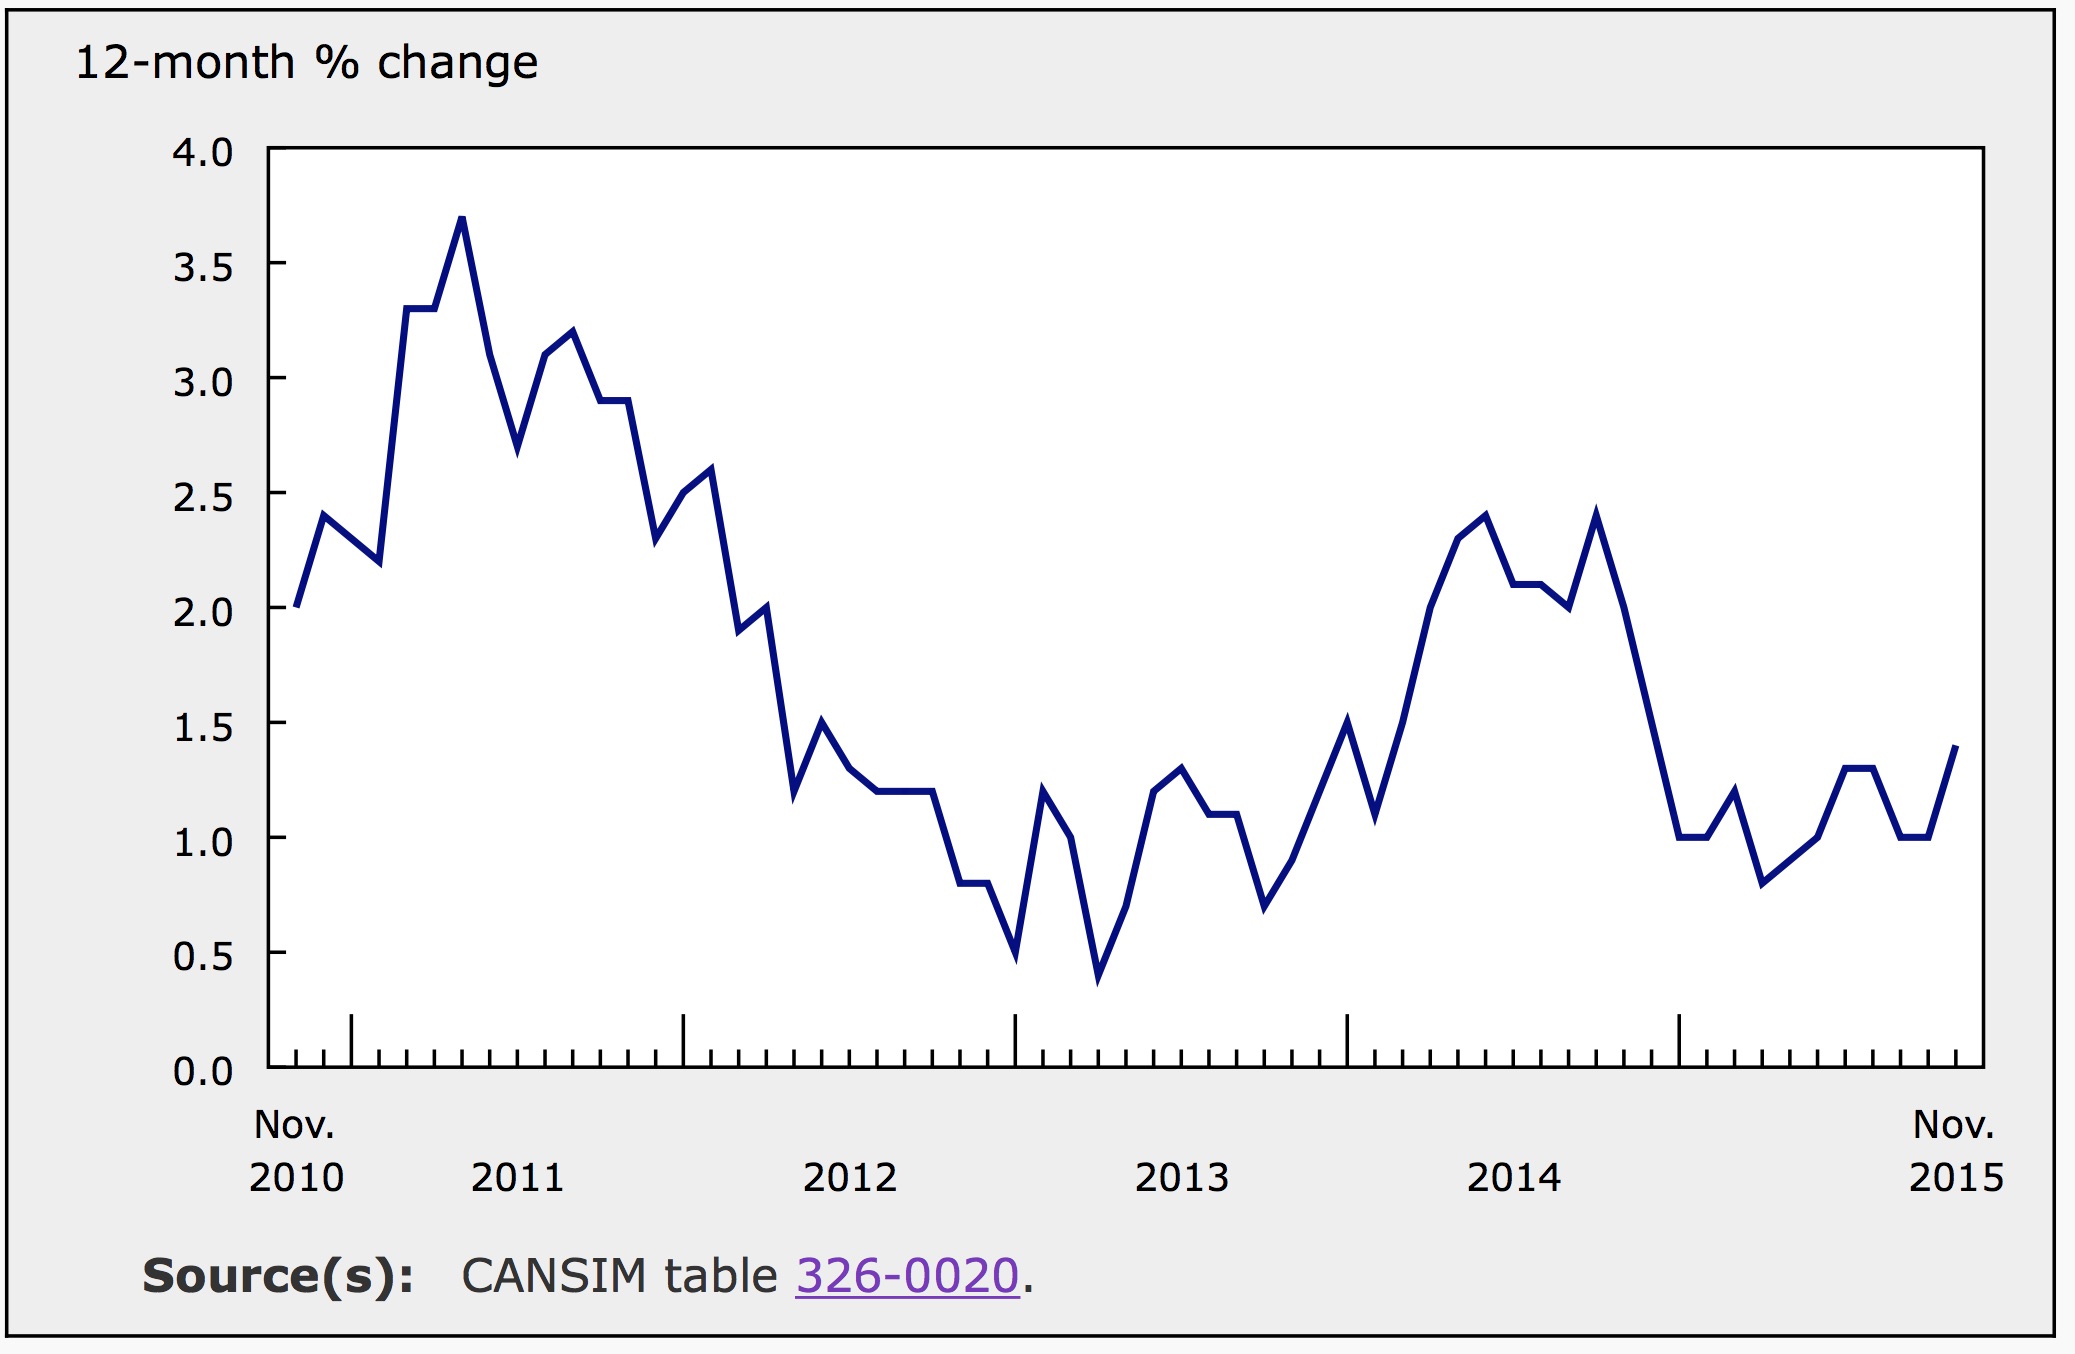
Statistics Canada released November’s inflation report this morning. While inflation by no means appears robust, the drag of falling gas prices has started to lift. Of the eight major components of the consumer price index (CPI), three fell and five increased in November. For the year ending in November, Canada’s CPI climbed 1.4%, missing expectations by 0.1% and remaining significantly below the Bank of Canada’s target inflation rate of 2%. November’s annual data shows modest underlying price pressure, especially when compared to the 1% rate posted for 12-months leading up to October.
Core inflation, which does not include volatile items like food and energy, was up 2% for the year ending in November compared to 2.1% for the year ending in October. The markets had expect core inflation to be significantly stronger; the consensus was 2.3%. In November, the core inflation index fell 0.3%. After seasonal adjustments, monthly core inflation was a positive 0.1% in November compared to 0.2% in October.
Seasonally Adjusted Inflation in November
Seasonally adjusted prices rose 0.2% in November, matching October’s gain. During the month, two of the eight major components of the CPI posted declines. Household operations, furnishings and equipment fell 0.6% following a 0.1% drop in October. Recreation education and reading dropped 0.3% in both November and October. The food index was unchanged in November after a 0.4% spike in the previous month.
Five of the major CPI components were higher in November with seasonal adjustments. The transportation index saw the largest increase, up 0.8%. Both the index for alcoholic beverages and tobacco and the index for clothing and footwear posted gains of 0.6% in November. The health and personal care index continues to climb steadily, up 0.3% in November and 0.2% in October. Finally, shelter costs recorded a marginal 0.1% increase in November.
| Consumer Price Index, seasonally adjusted (Percentage Change) | ||||||||||||
|---|---|---|---|---|---|---|---|---|---|---|---|---|
| Jan-2015 | Feb-2015 | Mar-2015 | Apr-2015 | May-2015 | Jun-2015 | Jul-2015 | Aug-2015 | Sept-2015 | Oct-2015 | Nov-2015 | Dec-2015 | |
| All-items (9) | -0.2 | 0.2 | 0.3 | -0.1 | 0.4 | 0.4 | 0.2 | 0 | -0.2 | 0.2 | 0.2 | 0.1 |
| Food | 0.7 | -0.1 | 0.2 | 0.4 | 0.4 | 0.1 | 0 | 0.3 | 0.4 | 0.4 | 0.0 | 0.6 |
| Shelter | 0.1 | 0 | 0.2 | -0.2 | 0.1 | 0.2 | 0.2 | 0.1 | 0 | 0.3 | 0.1 | 0.1 |
| Household operations, furnishings and equipment | 0.1 | 0.3 | 0.3 | 0.4 | 0.2 | 0.1 | 0.2 | 0.4 | 0.1 | -0.1 | -0.6 | 0.2 |
| Clothing and footwear | 0.4 | -0.1 | 0 | -0.3 | -0.2 | 0.2 | 0.7 | 0.4 | -0.1 | 0.2 | 0.6 | -0.9 |
| Transportation | -2.3 | 0.7 | 0.6 | 0.1 | 0.6 | 1.3 | 0.4 | -0.9 | -1.4 | 0.3 | 0.8 | 0.3 |
| Health and personal care | 0.3 | 0 | -0.2 | 0.2 | 0.3 | 0 | 0.2 | -0.2 | 0.2 | 0.2 | 0.3 | -0.2 |
| Recreation, education and reading | 0.7 | 0.7 | 0.4 | -0.8 | 0.8 | 0.4 | 0 | 0.3 | 0.3 | -0.3 | -0.3 | 0.0 |
| Alcoholic beverages and tobacco products | 0.5 | 0.3 | 0.3 | 0.5 | 0.3 | 0.1 | 0.1 | 0.3 | 0.2 | 0.0 | 0.6 | -0.2 |
| All-items excluding food and energy | 0.3 | 0.1 | 0.3 | 0.1 | 0.2 | 0.2 | 0.2 | 0.1 | 0.2 | 0.0 | 0.1 | 0.1 |
| Bank of Canada's core index (11) | 0.2 | 0.1 | 0.4 | 0.1 | 0.2 | 0.3 | 0.2 | 0.2 | 0.1 | 0.2 | 0.1 | 0.1 |
| Source: Statistics Canada. Table 326-0022 - Consumer Price Index, seasonally adjusted (Percentage Change (month-to-month)) | ||||||||||||
Annual Inflation
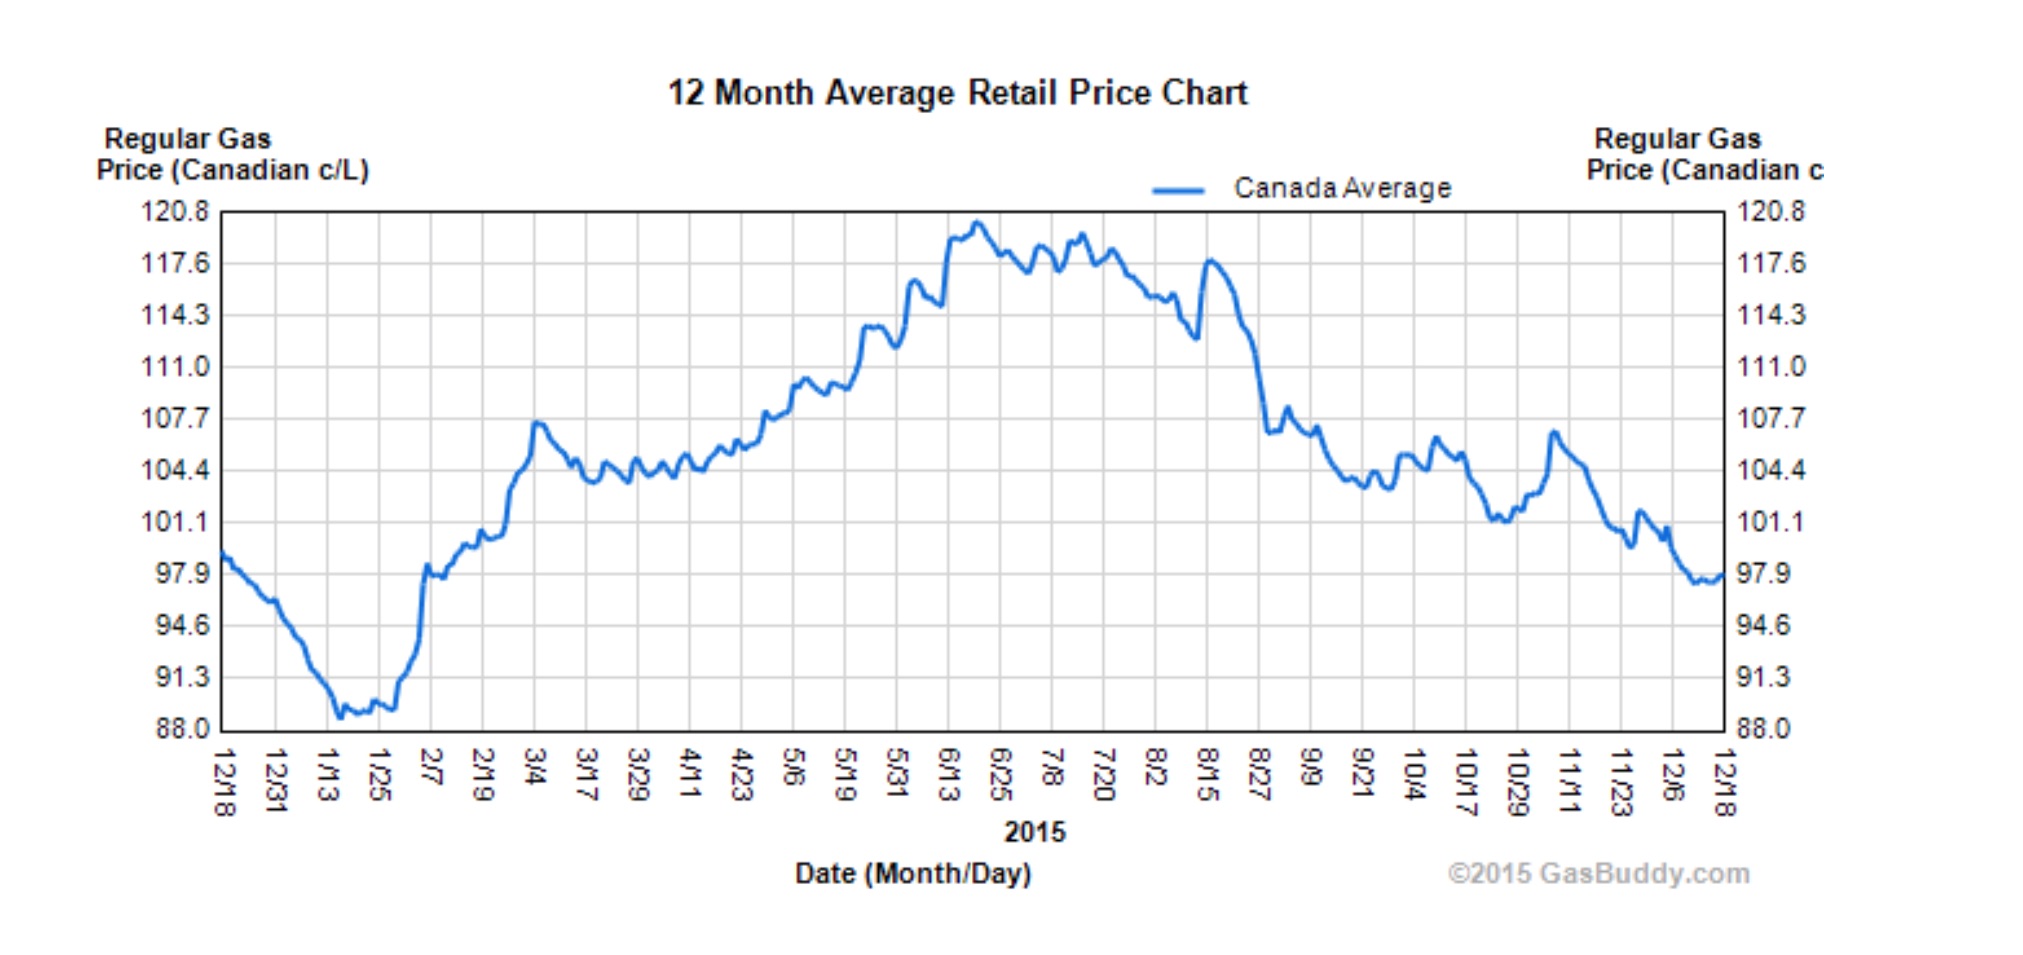
Year over year, every component of the CPI was higher in November with the exception of the transportation index. The transportation index was 1.1% lower compared to a year earlier. In October, this number was a negative 3.2%. The smaller decline in the annual transportation number was due to a smaller decline in gas prices for the year ending in November. Prior to seasonal adjustments, the gasoline index fell 0.3% in November following drops of 7.9% and 2% in September and October and compared to a decline of 7.5% in November of last year. The chart below shows high volatility in the price of gas in November. Volatility and weakness in gas prices have clearly masked underlying price pressure in other areas of the economy. The index for gasoline fell 10.6% for the year ending in November.
The food index posted the largest annual increase in November, up 3.4%. The index for alcoholic beverages and tobacco products gained 2.9% year over year. Recreation education and reading also bolstered the overall inflation rate, gaining an annual 1.9%. Shelter costs, which have been contributing to inflation in recent months, posted an increase of 1.2% for the year ending in November.
Inflation in the Provinces
Consumer prices were higher in every province for the 12-months ending in November. Even PEI posted its first positive annual rate of inflation in 12 months. Annual inflation was stronger in November compared to October in every province except Manitoba, which was impacted by declines in the price of natural gas.
In November, price levels increased in PEI and BC, remained flat in Saskatchewan and Ontario and declined in the remaining provinces. Nova Scotia saw the most significant monthly drop, down 0.5%. Because November’s declines were smaller than the declines posted in November 2014, every province saw annual numbers higher in November compared to October.
| Consumer Price Index (Percentage Change (month-to-month)) | ||||||||||||
|---|---|---|---|---|---|---|---|---|---|---|---|---|
| Jan-2015 | Feb-2015 | Mar-2015 | Apr-2015 | May-2015 | Jun-2015 | Jul-2015 | Aug-2015 | Sept-2015 | Oct-2015 | Nov-2015 | Dec-2015 | |
| Canada | -0.2 | 0.9 | 0.7 | -0.1 | 0.6 | 0.2 | 0.1 | 0 | -0.2 | 0.1 | -0.1 | -0.5 |
| Newfoundland and Labrador | -0.5 | 1 | 1.1 | -0.5 | 1 | 0.2 | -0.1 | 0.2 | -0.3 | 0.1 | -0.3 | -0.5 |
| Prince Edward Island | -1.1 | 1.2 | 1.2 | -0.7 | 0.6 | 0.5 | -0.1 | -0.2 | -0.5 | 0.0 | 0.2 | -0.3 |
| Nova Scotia | -0.4 | 0.9 | 1.2 | -0.1 | 0.5 | 0 | -0.1 | -0.1 | -0.4 | 0.2 | -0.5 | -0.2 |
| New Brunswick | -0.8 | 0.9 | 1 | -0.5 | 1 | 0.1 | 0.1 | -0.1 | -0.5 | 0.2 | -0.1 | -0.2 |
| Quebec | -0.2 | 1.1 | 0.6 | 0 | 0.5 | -0.1 | 0.1 | -0.1 | -0.1 | 0.1 | -0.2 | -0.4 |
| Ontario | -0.1 | 0.7 | 0.7 | -0.2 | 0.6 | 0.4 | 0.2 | -0.3 | -0.2 | 0.1 | 0.0 | -0.3 |
| Manitoba | -0.2 | 0.7 | 1.1 | -0.1 | 0.2 | 0.4 | -0.2 | 0.6 | -0.3 | 0.5 | -0.2 | -1.0 |
| Saskatchewan | -0.1 | 0.9 | 0.9 | 0 | 0.5 | 0.3 | -0.1 | 0.2 | -0.5 | 0.5 | 0.0 | -0.8 |
| Alberta | -0.4 | 0.8 | 0.8 | 0.1 | 0.4 | 0.7 | 0.1 | 0.3 | -0.3 | 0.4 | -0.3 | -0.9 |
| British Columbia | -0.1 | 0.8 | 0.8 | -0.2 | 0.8 | 0.1 | 0.1 | 0.2 | 0 | -0.3 | 0.2 | -0.3 |
| Whitehorse, Yukon [6001009] (13) | -1.1 | 0.2 | 0.7 | 0.4 | 0.7 | 0.6 | 0.2 | 0.5 | -0.3 | -0.9 | -0.4 | 1.0 |
| Yellowknife, Northwest Territories [6106023] (13) | -0.5 | 0.2 | 0.8 | 0.3 | 0.6 | 0.6 | -0.1 | 0.2 | -0.3 | 0.3 | -0.5 | -0.3 |
| Iqaluit, Nunavut | 0.3 | 0.6 | 0.2 | 0.8 | 0.3 | 0.5 | 0.2 | 0.1 | 0.3 | -0.5 | -0.1 | -0.2 |
| Source: Statistics Canada. Table 326-0020 - Consumer Price Index (Percentage Change (month-to-month)) |
Economic Outlook
South of the border, the Federal Reserve raised interest rates for the first time in nearly a decade earlier this week. In reality, the move is only marginal and the strength behind this new tightening cycle remains to be seen. The move is largely a signal to the markets that the Fed can and will follow through with the expectations they have established. It also affirms their belief that the US economy is finally strong enough to begin tightening.
If the US continues to raise rates, Canadian monetary policy will diverge more and more from that of its neighbour. If this is the case, the Canadian dollar and oil prices will fall even further. The Bank of Canada will likely keep rates flat for the foreseeable future. Rate cuts even remain a possibility as the economy struggles with cheap oil and the resulting slide in the Loonie. While falling oil prices may continue to limit overall inflation in the coming months, Canada’s weak currency will put pressure on prices throughout much of the economy.


