
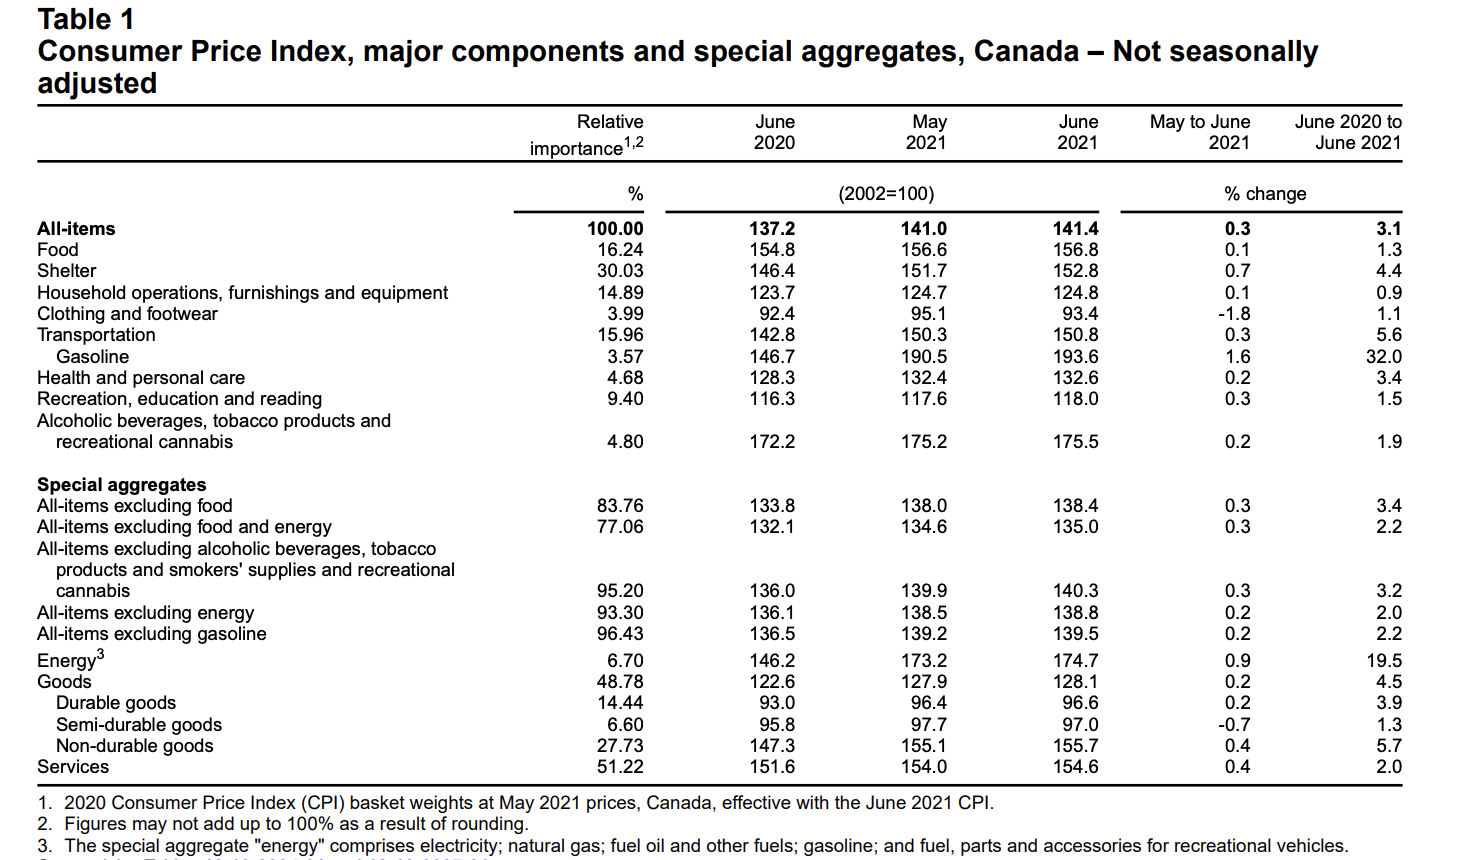
The Consumer Price Index increased 3.1 % in June, on a year-over-year basis reported Statistics Canada. This was a percentage decrease from the 3.6% rise seen in May.
“As a result of price increases in June 2020, base-year effects had a downward impact on consumer inflation, contributing to the slowdown in June 2021,” explained Stats Can in its report.
Excluding the price of gas, the CPI increased 2.2% over the last 12-month span. In June 2021, monthly CPI increased 0.3%, a decrease from the 0.5% rise seen in May. On a seasonally adjusted monthly basis, the CPI edged up 0.1%.
(Source: Statistics Canada)
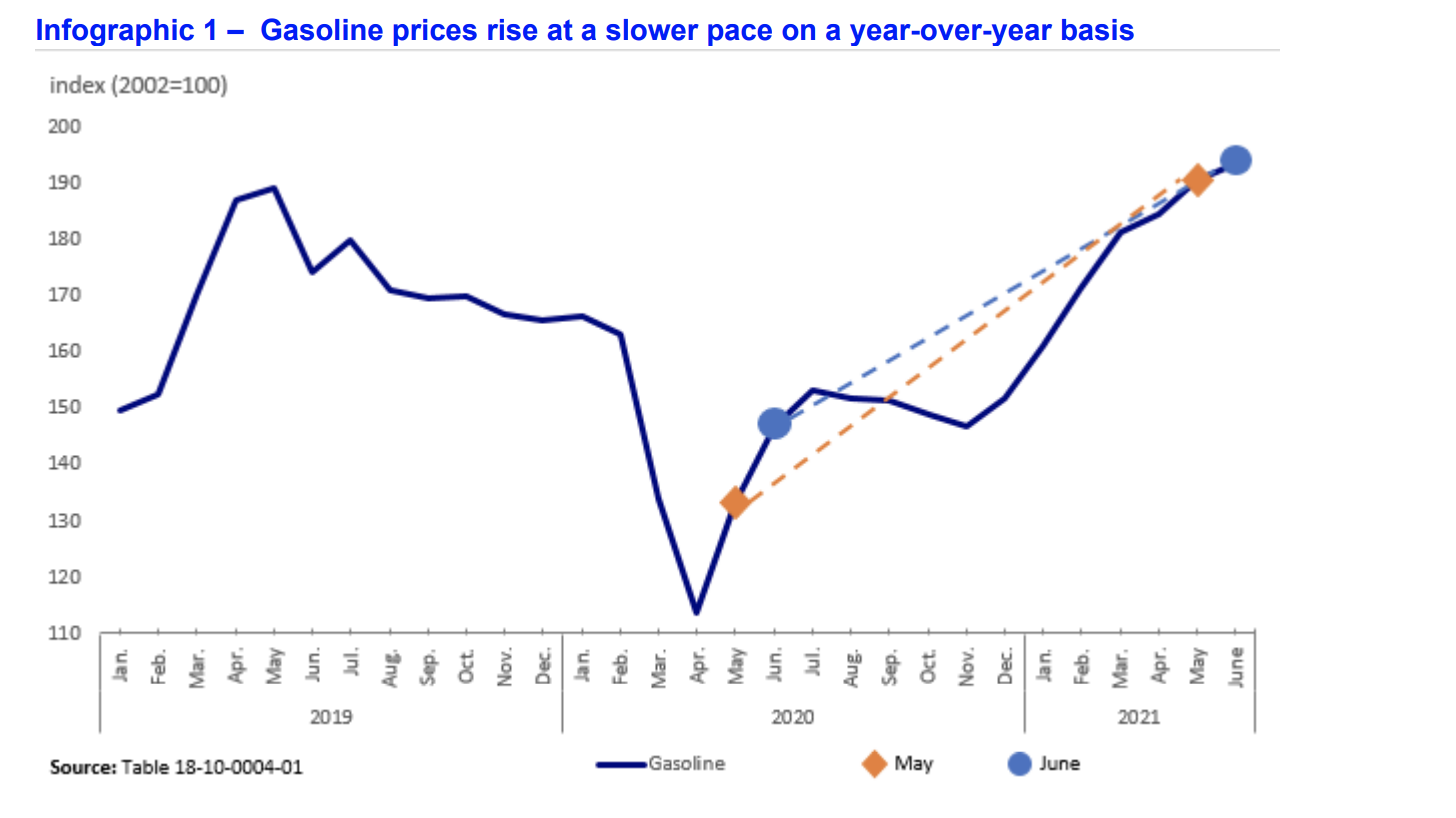
Gasoline
In June, the price of gasoline increased 32% year-over-year, compared to the 43.4% rise seen in May, “ due to a base-year effect”.
“The slower price growth in June stemmed from an increase in June 2020, when gasoline prices partially recovered after falling significantly during the early stages of the pandemic. Gasoline prices rose 10.5% month over month in June 2020, the result of higher demand as businesses gradually reopened,” explained Statistics Canada.
Shelter Index
In June, the index for shelter increased 4.4% over the past 12-months period. In its monthly report, Statistics Canada stated that this continued percentage increase was “driven mostly by the continued rise in the homeowners’ replacement cost index, up 12.9% in the 12 months to June. Prices for new homes continue to be impacted by shifting consumer preferences as well as higher building costs compared with June 2020”.
Despite the rise in shelter costs, there was a drop in the mortgage interest cost index.
“Conversely, the mortgage interest cost index fell 8.6% year over year, the strongest decline on record, as interest rates remained at historically low levels,” stated the agency.
Food Index
The food index increased 1.3% year-over-year since June 2020. Yet, the index for fresh vegetables decreased for the fourth consecutive month.
“The fresh vegetables index continued to trend downwards in June, falling 7.5% year over year — the largest yearly decline since March 2017. This was partially attributable to lower prices for tomatoes (-30.3%) and potatoes (-7.7%) in June. The declines occurred amid increased supply stemming from favourable weather conditions in growing regions. In addition, the fall in prices for tomatoes was partly driven by a base-year effect as prices rose 16.2% month over month in June 2020 due to lower supply,” said Stats Can.
(Source: Statistics Canada)
In its monthly report, Statistics Canada issued a statement regarding an updated basket of goods:
“The basket of goods and services used in the calculation of the Consumer Price Index (CPI) has been updated with the release of the June 2021 data. For the first time, several new sources of expenditure data were used to ensure the new CPI weights reflect evolving consumer spending patterns, particularly as the country transitions from pandemic response to recovery. The new basket weights are based on 2020 expenditure data, which include information on pre-pandemic expenditures, initial pandemic impacts, some recovery data, and the emergence of new consumption patterns. The data reflect shifts in spending due to the COVID-19 pandemic that will likely take some time to stabilize across goods and services, and geographic regions.
The new basket weight reference period is 2020, based on the national household final consumption expenditure (HFCE) data, in addition to data from the Survey of Household Spending and provincial HFCE series. Alternative data for 2020 has been used to account for pandemic-related shifts at more detailed levels of geography and CPI components.
The base period, in which the CPI is set to equal 100, remains 2002.
The headline CPI for June 2021 would have been the same using the 2017 basket weights.
For more detailed information, consult the document entitled “An Analysis of the 2021 Consumer Price Index Basket Update, Based on 2020 Expenditures” in the Prices Analytical Series (62F0014M) and the infographic entitled “The Consumer Price Index: Keeping Up with Canadian Consumers“.
Source cited: https://www150.statcan.gc.ca/n1/daily-quotidien/210728/dq210728a-eng.htm
Sarah has been writing on the topics of politics, history and finance for over a decade. She is currently an editor at CPI Inflation Calculator, covering the topics of CPI, inflation, US economy and economic commentary.