
Once again falling gasoline prices are the major theme in Canada’s inflation story. Statistics Canada announced today that the seasonally adjusted Consumer Price Index (CPI) fell 0.2% in September after remaining flat in August. September’s CPI data came in marginally below consensus estimates.
For the year ending in September, headline inflation was 1%, compared to 1.3% for the years ending in both July and August. Core inflation managed to inch up 0.1% in September compared with 0.2% in the previous month. Core inflation for the year ending in September was 2.1%, in line with August’s number and just below the consensus estimates of 2.2%.
Overall price levels were down in every province in September except British Columbia. B.C. posted no change for the month. The biggest driver of September’s declining CPI was the decline in gasoline prices, which fell 18.8% over the 12-month period including a decline of 7.9% in September alone.

Fuel prices are not expected to rebound soon. U.S. oil inventories continue to grow while global growth and demand for oil remains sluggish.
Inflation in the Month of September
The 0.2% decline in seasonally adjusted prices for the month of September reflects declines in only 2 of the 8 major CPI components. The transportation index fell significantly, down 1.4% for the month alone and the index for clothing and footwear slipped marginally, down 0.1% for the month. Every other component of the CPI saw positive seasonally adjusted growth in September.
The food index had the largest positive impact on overall CPI growth, climbing a seasonally adjusted 0.4%. Without seasonal adjustments, the food index fell 0.4% in September. Vegetable prices and bakery and cereal prices showed the largest non-seasonally adjusted monthly declines, falling 1.5% and 1.4% respectively. The indexes for non-alcoholic beverages and processed meat were both down 2% in August. However, with seasonal adjustments, food prices are higher in September.
The index for recreation, education and reading also climbed 0.4% in September, with seasonal adjustments. There was no change in the shelter index on a seasonally adjusted or non-seasonally adjusted basis for the month. This is despite a decline of 4.6% in the price of fuel and fuel oils, which are included as part of shelter costs. September also saw a 3.6% increase in the price of telephone equipment, before seasonal adjustments.
The price of women’s clothing was 4.9% higher, men’s clothing was 1.3% higher and children’s clothing posted 3% higher price levels. The net clothing and footwear index climbed 2.9% in September. After seasonal adjustments, this index declined by 0.1% for the month.
| Consumer Price Index, seasonally adjusted (Percentage Change) | ||||||||||||
|---|---|---|---|---|---|---|---|---|---|---|---|---|
| Jan-2015 | Feb-2015 | Mar-2015 | Apr-2015 | May-2015 | Jun-2015 | Jul-2015 | Aug-2015 | Sept-2015 | Oct-2015 | Nov-2015 | Dec-2015 | |
| All-items (9) | -0.2 | 0.2 | 0.3 | -0.1 | 0.4 | 0.4 | 0.2 | 0 | -0.2 | 0.2 | 0.2 | 0.1 |
| Food | 0.7 | -0.1 | 0.2 | 0.4 | 0.4 | 0.1 | 0 | 0.3 | 0.4 | 0.4 | 0.0 | 0.6 |
| Shelter | 0.1 | 0 | 0.2 | -0.2 | 0.1 | 0.2 | 0.2 | 0.1 | 0 | 0.3 | 0.1 | 0.1 |
| Household operations, furnishings and equipment | 0.1 | 0.3 | 0.3 | 0.4 | 0.2 | 0.1 | 0.2 | 0.4 | 0.1 | -0.1 | -0.6 | 0.2 |
| Clothing and footwear | 0.4 | -0.1 | 0 | -0.3 | -0.2 | 0.2 | 0.7 | 0.4 | -0.1 | 0.2 | 0.6 | -0.9 |
| Transportation | -2.3 | 0.7 | 0.6 | 0.1 | 0.6 | 1.3 | 0.4 | -0.9 | -1.4 | 0.3 | 0.8 | 0.3 |
| Health and personal care | 0.3 | 0 | -0.2 | 0.2 | 0.3 | 0 | 0.2 | -0.2 | 0.2 | 0.2 | 0.3 | -0.2 |
| Recreation, education and reading | 0.7 | 0.7 | 0.4 | -0.8 | 0.8 | 0.4 | 0 | 0.3 | 0.3 | -0.3 | -0.3 | 0.0 |
| Alcoholic beverages and tobacco products | 0.5 | 0.3 | 0.3 | 0.5 | 0.3 | 0.1 | 0.1 | 0.3 | 0.2 | 0.0 | 0.6 | -0.2 |
| All-items excluding food and energy | 0.3 | 0.1 | 0.3 | 0.1 | 0.2 | 0.2 | 0.2 | 0.1 | 0.2 | 0.0 | 0.1 | 0.1 |
| Bank of Canada's core index (11) | 0.2 | 0.1 | 0.4 | 0.1 | 0.2 | 0.3 | 0.2 | 0.2 | 0.1 | 0.2 | 0.1 | 0.1 |
| Source: Statistics Canada. Table 326-0022 - Consumer Price Index, seasonally adjusted (Percentage Change (month-to-month)) | ||||||||||||
Annual Inflation Numbers
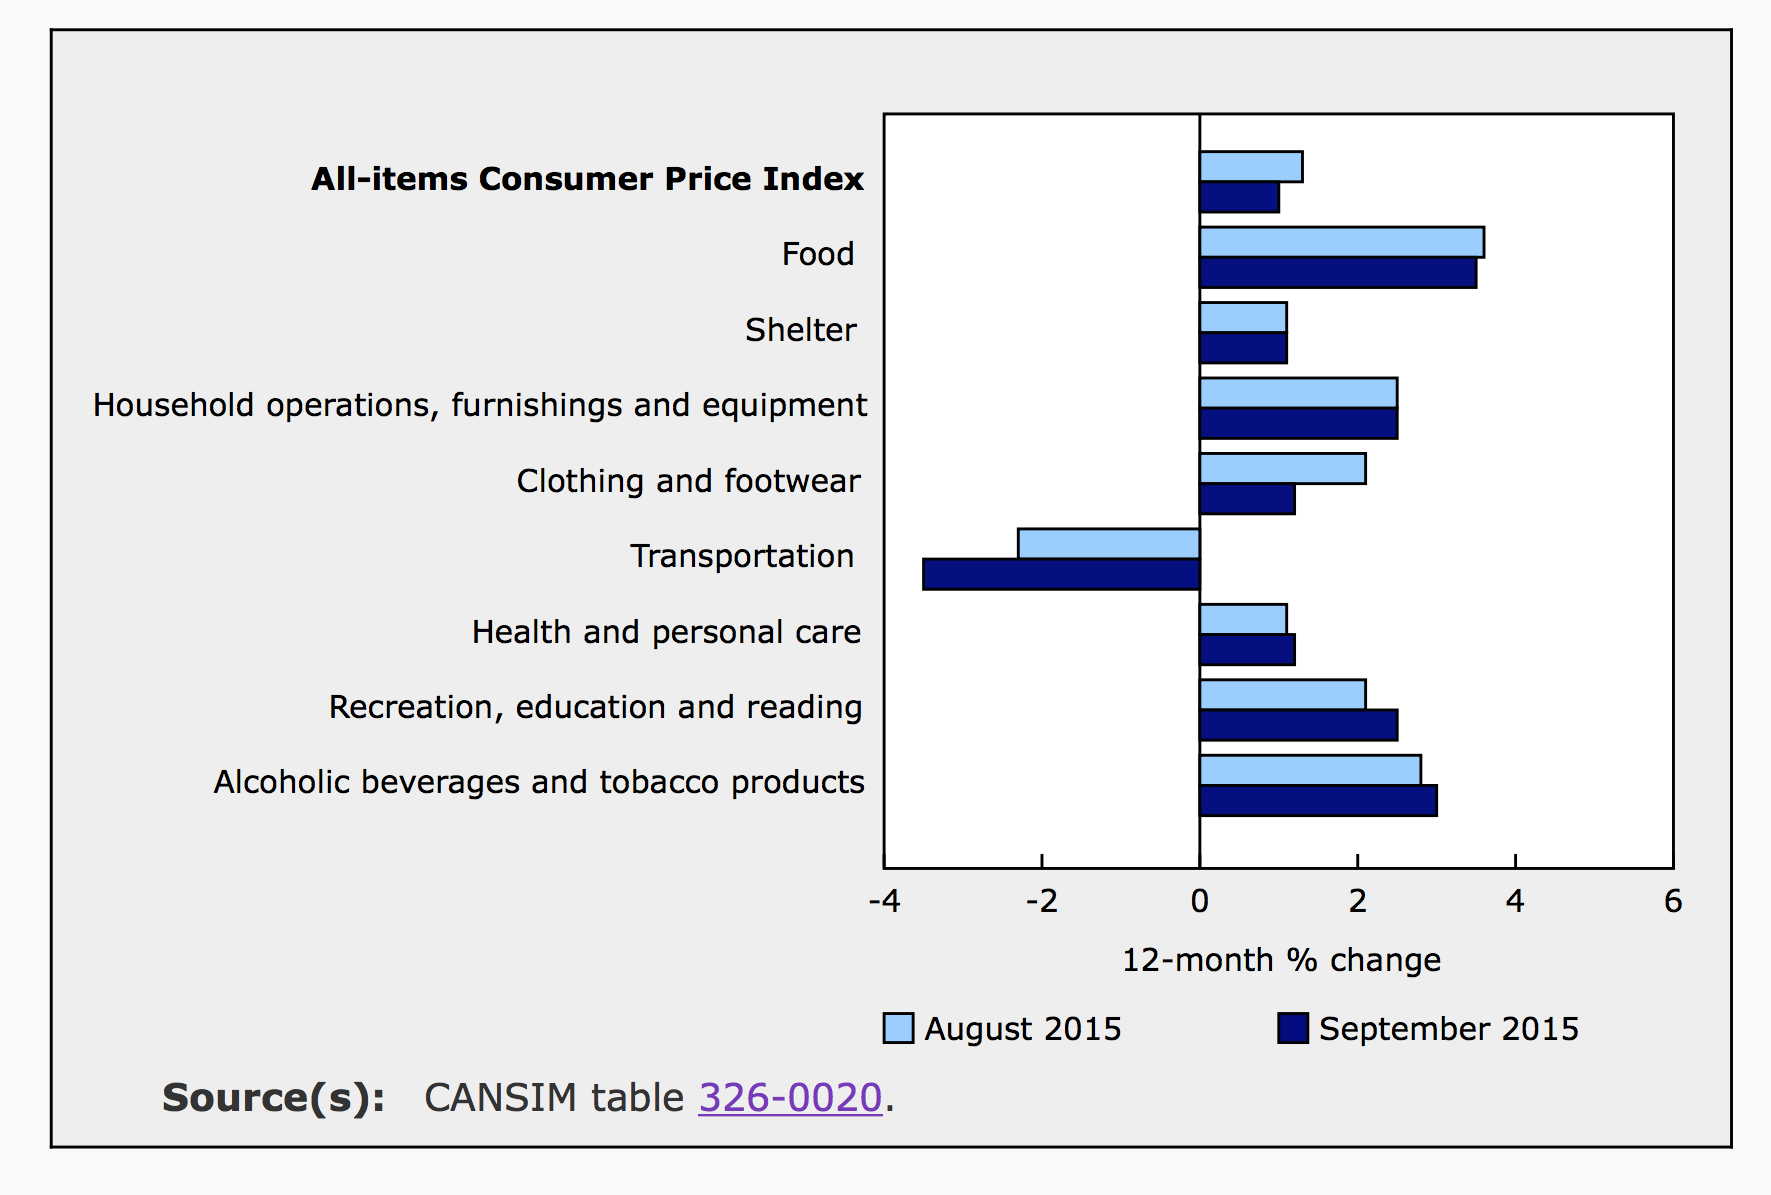
Transportation was the only major index to post a year over year decline in September, falling 3.5% after falling 2.3% in August. This is because gas prices fell nearly 8% in September alone. The energy index, which includes prices for electricity, natural gas, fuel, gasoline and vehicle parts, tumbled 10.8% over the 12-month period ending in September. This includes an 18.7% decline in the price of gasoline.
Excluding the drastic declines in energy prices, the index for all other items posted healthy growth of 2.1% for the year ending in September. The Index for food was 3.5% higher in September compared to a year earlier and after seasonal adjustments. This includes and increase of 3.9% in the cost of food purchased from stores and 2.7% in the cost of food purchased from restaurants. Vegetables prices climbed 11.5% for the year while the price of meat was 4.4% higher.
The index for recreation and reading grew 2.5% for the year, driven by a 10.8% spike in the price of traveler’s accommodations. Clothing and Footwear were 1.2% higher year over year.
Over this 12-month period, the price index for goods fell 0.1%, which is more positive than the 0.6% annual decline in the price of goods for the year ending in August. This is largely related to falling commodity prices. The cost of services, on the other hand, has increased by 1.9% for the year ending in September versus annual growth of only 0.2% posted in August.
Inflation by Province
For the year ending in September, PEI was the only province to post a negative inflation number. The CPI for the province was down 0.8%. This is the 10th consecutive month of annual declines in PEI’s CPI. This can be explained by declining fuel oil prices and a very heavy reliance on fuel oil in the province. For the year ending in September, the price of fuel oil plummeted 31.3%, compared to the year ending in August, which saw a decline in the price of fuel oil of nearly 24%.
Ontario, Manitoba, Saskatchewan, Alberta and B.C. all recorded annual inflation rates between 1.3% and 1.4%. Over the same period, prices were flat in Nova Scotia while Newfoundland and New Brunswick saw sluggish annual inflation rates of 0.4% and 0.3% respectively.
September’s monthly CPI numbers were negative in every province except British Columbia, where overall price levels posted no change. The other provinces saw prices fall between 0.2% and 0.5% for the month. While gas prices fell in every province, price levels in B.C. were bolstered by higher prices for men’s clothing and media subscription services.
| Consumer Price Index (Percentage Change (month-to-month)) | ||||||||||||
|---|---|---|---|---|---|---|---|---|---|---|---|---|
| Jan-2015 | Feb-2015 | Mar-2015 | Apr-2015 | May-2015 | Jun-2015 | Jul-2015 | Aug-2015 | Sept-2015 | Oct-2015 | Nov-2015 | Dec-2015 | |
| Canada | -0.2 | 0.9 | 0.7 | -0.1 | 0.6 | 0.2 | 0.1 | 0 | -0.2 | 0.1 | -0.1 | -0.5 |
| Newfoundland and Labrador | -0.5 | 1 | 1.1 | -0.5 | 1 | 0.2 | -0.1 | 0.2 | -0.3 | 0.1 | -0.3 | -0.5 |
| Prince Edward Island | -1.1 | 1.2 | 1.2 | -0.7 | 0.6 | 0.5 | -0.1 | -0.2 | -0.5 | 0.0 | 0.2 | -0.3 |
| Nova Scotia | -0.4 | 0.9 | 1.2 | -0.1 | 0.5 | 0 | -0.1 | -0.1 | -0.4 | 0.2 | -0.5 | -0.2 |
| New Brunswick | -0.8 | 0.9 | 1 | -0.5 | 1 | 0.1 | 0.1 | -0.1 | -0.5 | 0.2 | -0.1 | -0.2 |
| Quebec | -0.2 | 1.1 | 0.6 | 0 | 0.5 | -0.1 | 0.1 | -0.1 | -0.1 | 0.1 | -0.2 | -0.4 |
| Ontario | -0.1 | 0.7 | 0.7 | -0.2 | 0.6 | 0.4 | 0.2 | -0.3 | -0.2 | 0.1 | 0.0 | -0.3 |
| Manitoba | -0.2 | 0.7 | 1.1 | -0.1 | 0.2 | 0.4 | -0.2 | 0.6 | -0.3 | 0.5 | -0.2 | -1.0 |
| Saskatchewan | -0.1 | 0.9 | 0.9 | 0 | 0.5 | 0.3 | -0.1 | 0.2 | -0.5 | 0.5 | 0.0 | -0.8 |
| Alberta | -0.4 | 0.8 | 0.8 | 0.1 | 0.4 | 0.7 | 0.1 | 0.3 | -0.3 | 0.4 | -0.3 | -0.9 |
| British Columbia | -0.1 | 0.8 | 0.8 | -0.2 | 0.8 | 0.1 | 0.1 | 0.2 | 0 | -0.3 | 0.2 | -0.3 |
| Whitehorse, Yukon [6001009] (13) | -1.1 | 0.2 | 0.7 | 0.4 | 0.7 | 0.6 | 0.2 | 0.5 | -0.3 | -0.9 | -0.4 | 1.0 |
| Yellowknife, Northwest Territories [6106023] (13) | -0.5 | 0.2 | 0.8 | 0.3 | 0.6 | 0.6 | -0.1 | 0.2 | -0.3 | 0.3 | -0.5 | -0.3 |
| Iqaluit, Nunavut | 0.3 | 0.6 | 0.2 | 0.8 | 0.3 | 0.5 | 0.2 | 0.1 | 0.3 | -0.5 | -0.1 | -0.2 |
| Source: Statistics Canada. Table 326-0020 - Consumer Price Index (Percentage Change (month-to-month)) |
October’s Monetary Policy Report and Interest Rate Announcement
On Wednesday, the Bank of Canada announced that it will maintain its target overnight rate at 0.5%. According to the Bank’s interest rate announcement, underlying inflation remains around 1.5% to 1.7%, the low end of their 1% to 3% target range. Core inflation is closer to 2% as imported core goods have become more expensive with the falling Canadian dollar. At the same time, fuel prices, which are not included in the Core CPI continue to trend lower. According to the Bank, ‘the risks around the profile for inflation are roughly balanced.’ The next rate announcement is scheduled for December 2, 2015.
Although less than predicted earlier in the year, the Bank expects global economic activity should strengthen over the next couple of years. In Canada, accommodative monetary policy, the positive impacts of cheap oil and growth in the U.S. attracting more of Canada’s exports are all positive factors.
On the other hand, a slowdown in emerging markets that drives down commodity prices is a significant risk for Canada’s economy. If and when the U.S. does raise rates, emerging market economies could be on shaky ground and demand for Canada’s commodities could fall even more.
The decline of Canada’s commodity driven currency means that firms are cutting production and investment in the resource sector. According to Wednesday’s Monetary Policy Report, the Bank of Canada estimates ‘that the oil price shock, on its own, took about 1 1/4 percentage points off GDP growth in the first half of the year.’ They expect the economy to return to its full potential around mid-2017. Noting that Canada’s recovery could be slow because capacity in non-resource sectors needs to expand and new firms must be created outside of the resource economy.
Emily is a Canadian financial blogger with multiple degrees in economics and extensive professional experience as a financial analyst. She was formerly a Ph.D. candidate at the University of Guelph's School of Agricultural Economics. Before that, she received an MA from the University of San Francisco in International Development Economics. She also has a BA in Math with a minor in Economics.