
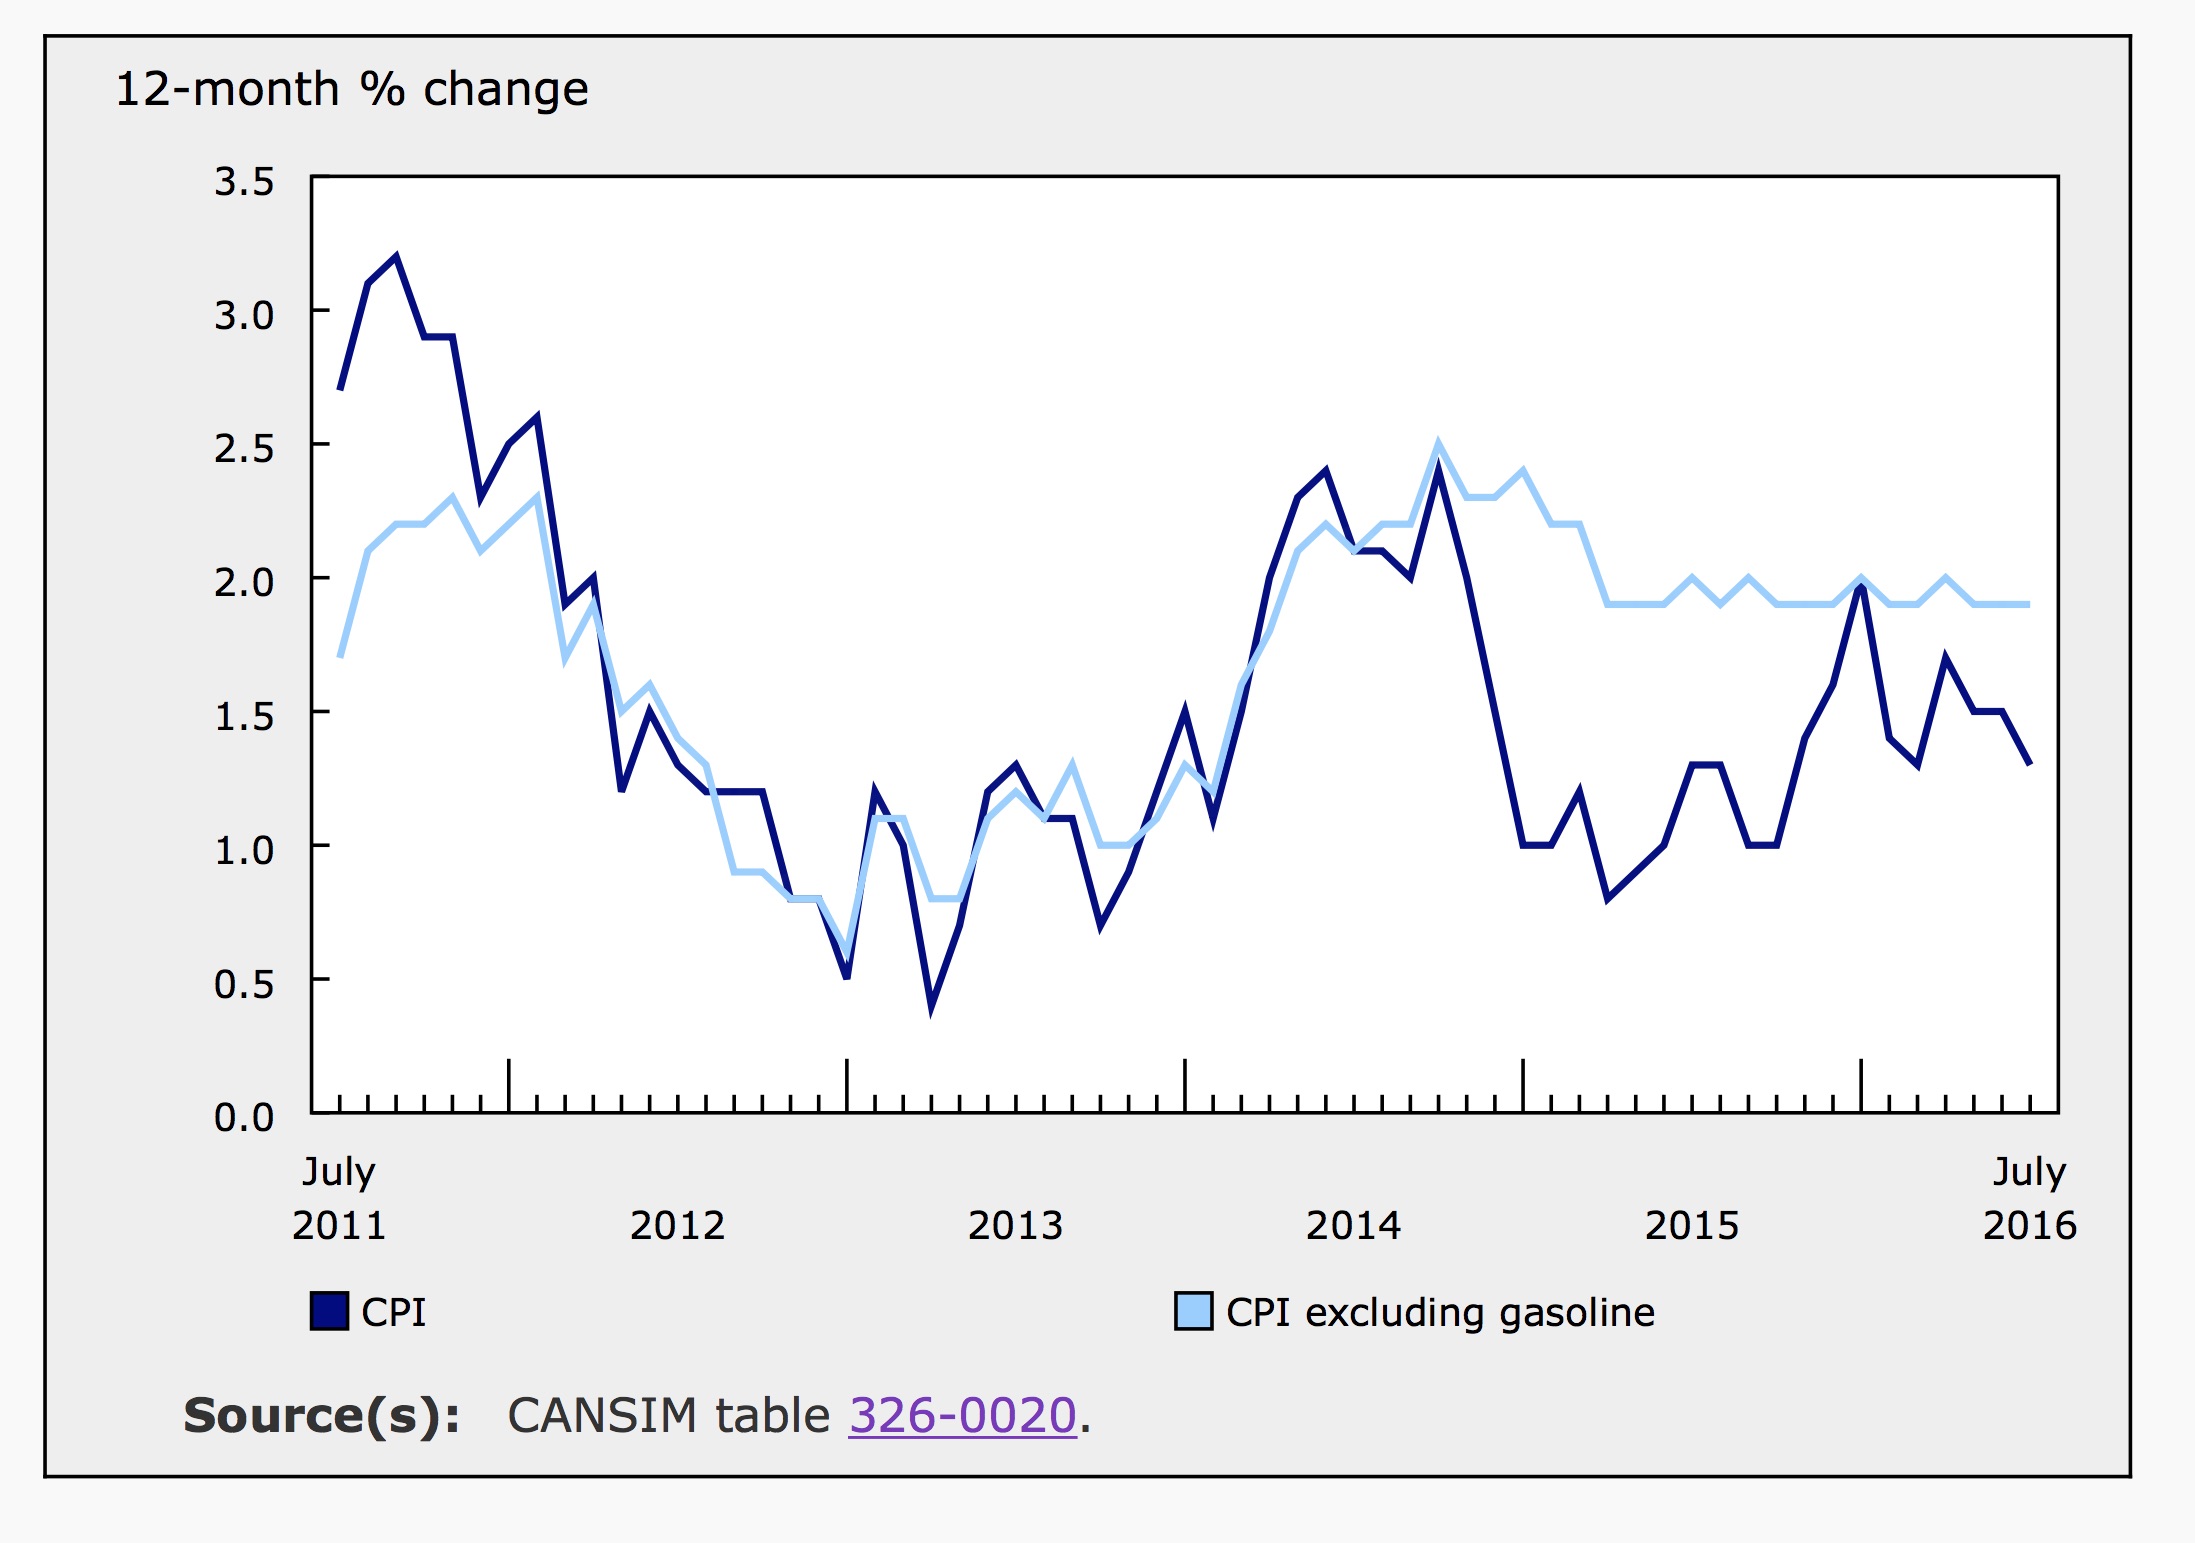
According to Statistics Canada, the consumer price index fell 0.2% in July to reverse June’s 0.2% growth in consumer prices. Year-over-year, headline inflation was 1.3% in July, down from 1.5% in both May and June. Economists surveyed by Bloomberg had expected annual inflation of 1.4% for the year ending in July.
Much of the deceleration in the inflation rate resulted from another stumble in the price of gas. Gas was 14% cheaper over the 12-months ending in July; excluding gas, annual inflation was 1.9%, unchanged from the previous month. Core inflation, which excludes a handful of consumer items with volatile prices such as gas and certain food items, was up 2.1% year-over-year, also unchanged from June. These indexes suggest underlying inflationary trends are in-line with the Bank’s 2% target since early last year.
July Inflation
The monthly dip in overall price levels was largely driven by declines in the transportation index, down 1.6% in the month of July due to tumbling gas prices. At the pump, prices were 5.6% lower in July compared to June. The price of clothing and footwear declined 1.6% in July as well. Food and shelter prices were both up by 0.3% over the month.
With seasonal adjustments, the CPI was flat in July compared to June, this following four consecutive months of 0.2% growth. The core index added 0.1% after seasonal adjustments in July, down from 0.2% in May and June.With seasonal adjustments, the transportation index was down 0.9% and the index for clothing and footwear declined by 0.6%. These declines were balanced by higher prices in five of the eight major components of the CPI. The health and personal care index was flat for the month.
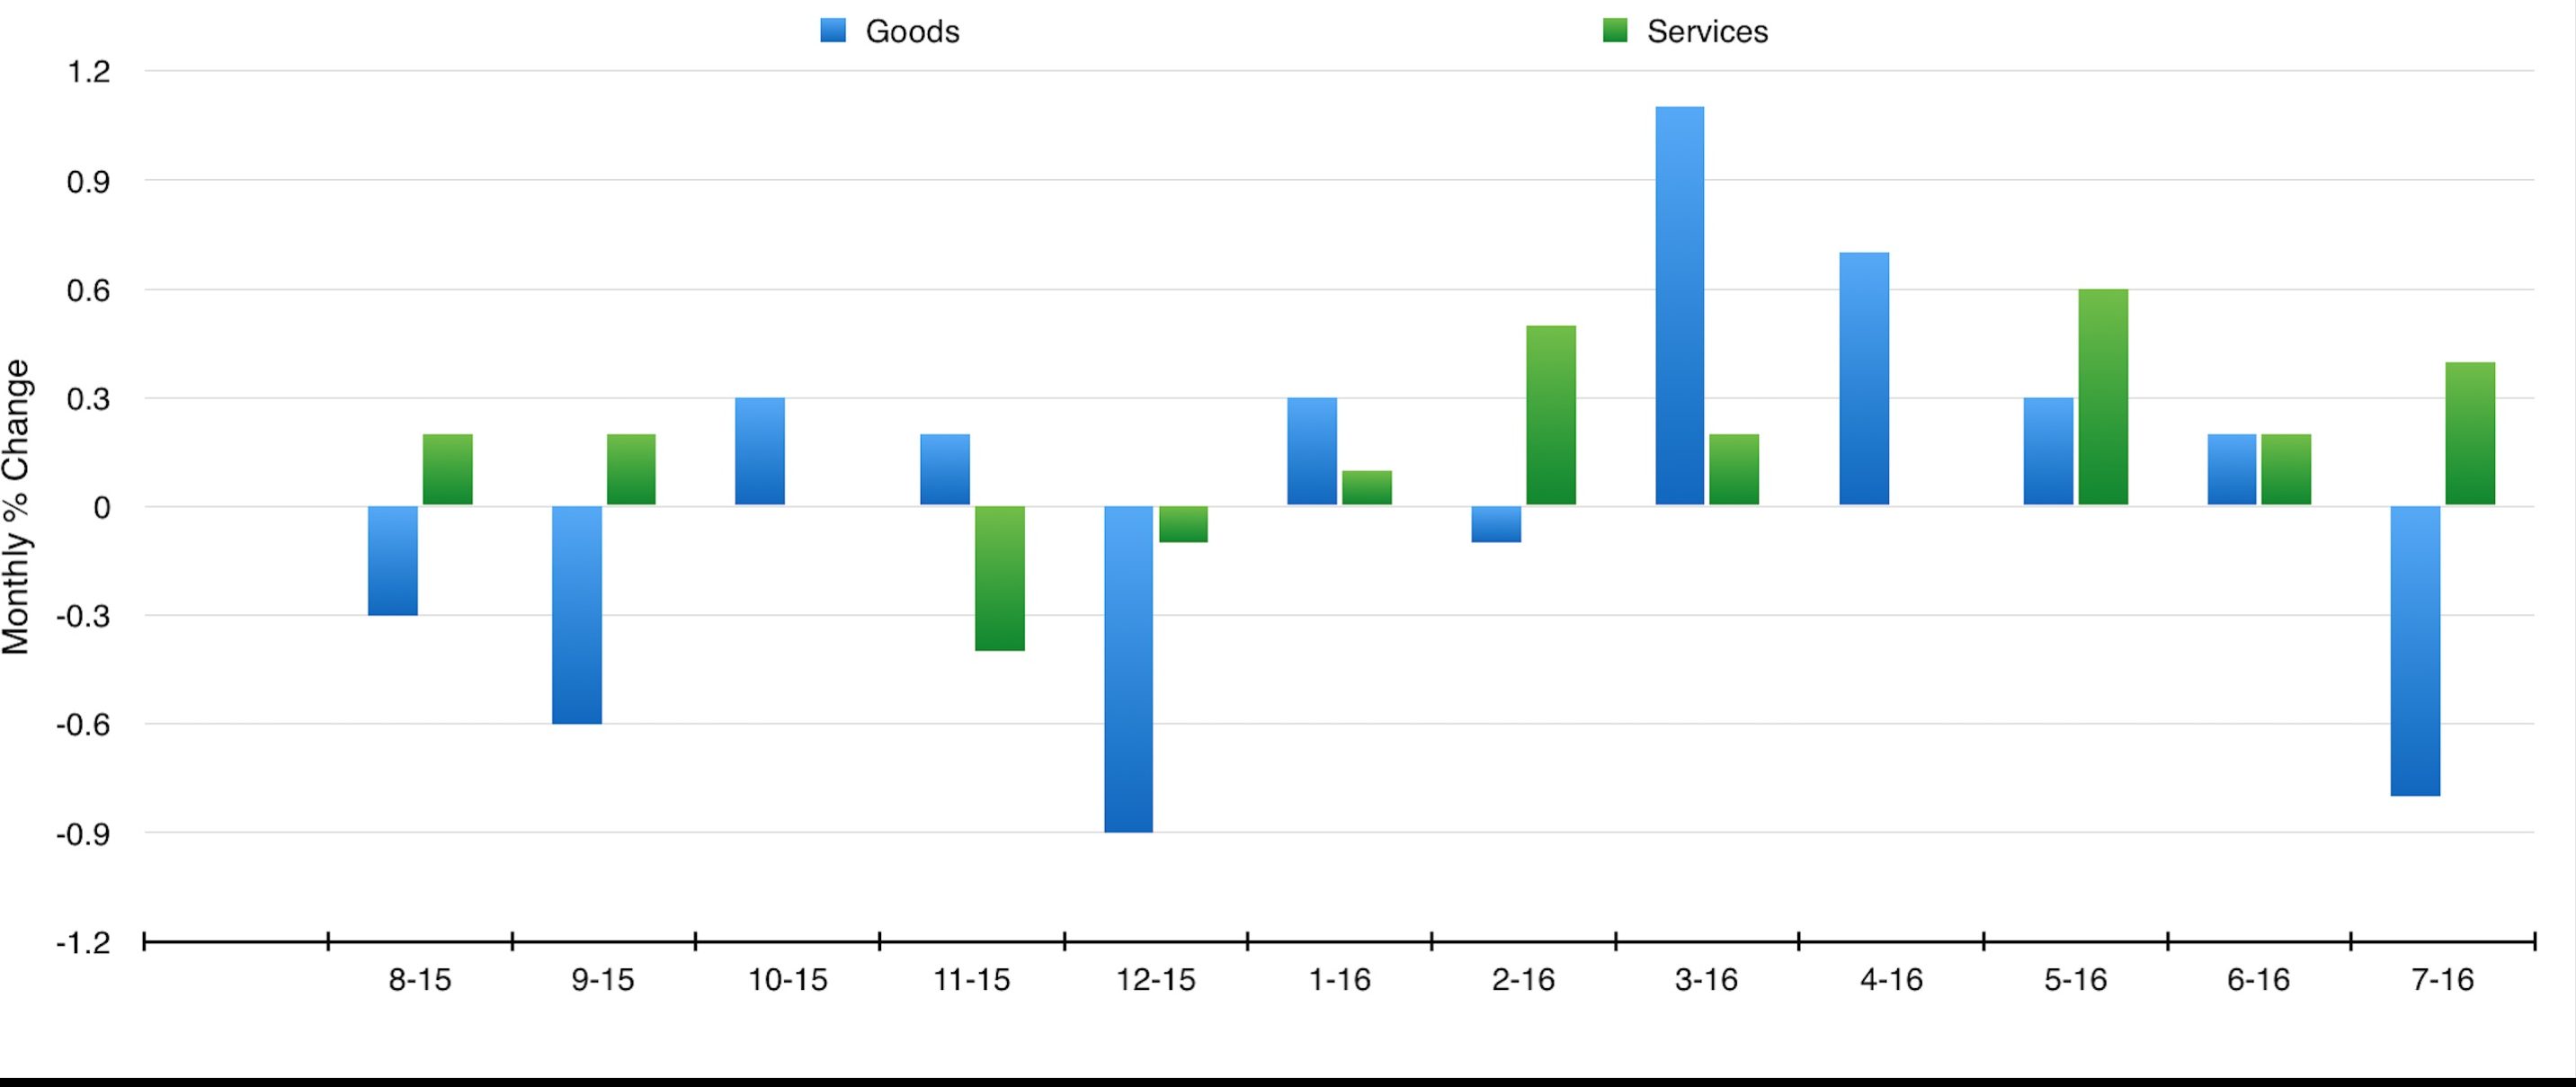
Stat Canada disaggregates the CPI into goods and services to create two subindexes. In July, the index for goods fell by 0.8% while the index for services increased by 0.4%. The graph below illustrates the monthly inflation in the prices of goods and services over the past 12 months. Year-over-year, the index for goods in up only 0.3% compared to 2.1% growth in the index for services.
Inflation Over 12-Months
Year-over-year, falling energy prices continue to muffle inflation. The energy index was down 7.4% over the 12-months ending in July, following an annual decline of only 4.4% in June. According to Stat Canada, “the special aggregate ‘energy’ comprises electricity, natural gas, fuel oil and other fuels, gasoline, and fuel, parts and accessories for recreational vehicles.” In aggregate, the items in the energy index account for 7.8% of the CPI.
Of the eight major components of the price index, two were lower year-over-year. The transportation index, which is about 19% of the total CPI, slipped 0.2%. Clothing and footwear, which is determined to account for about 6% of consumer spending, also declined by 0.2% year-over-year.
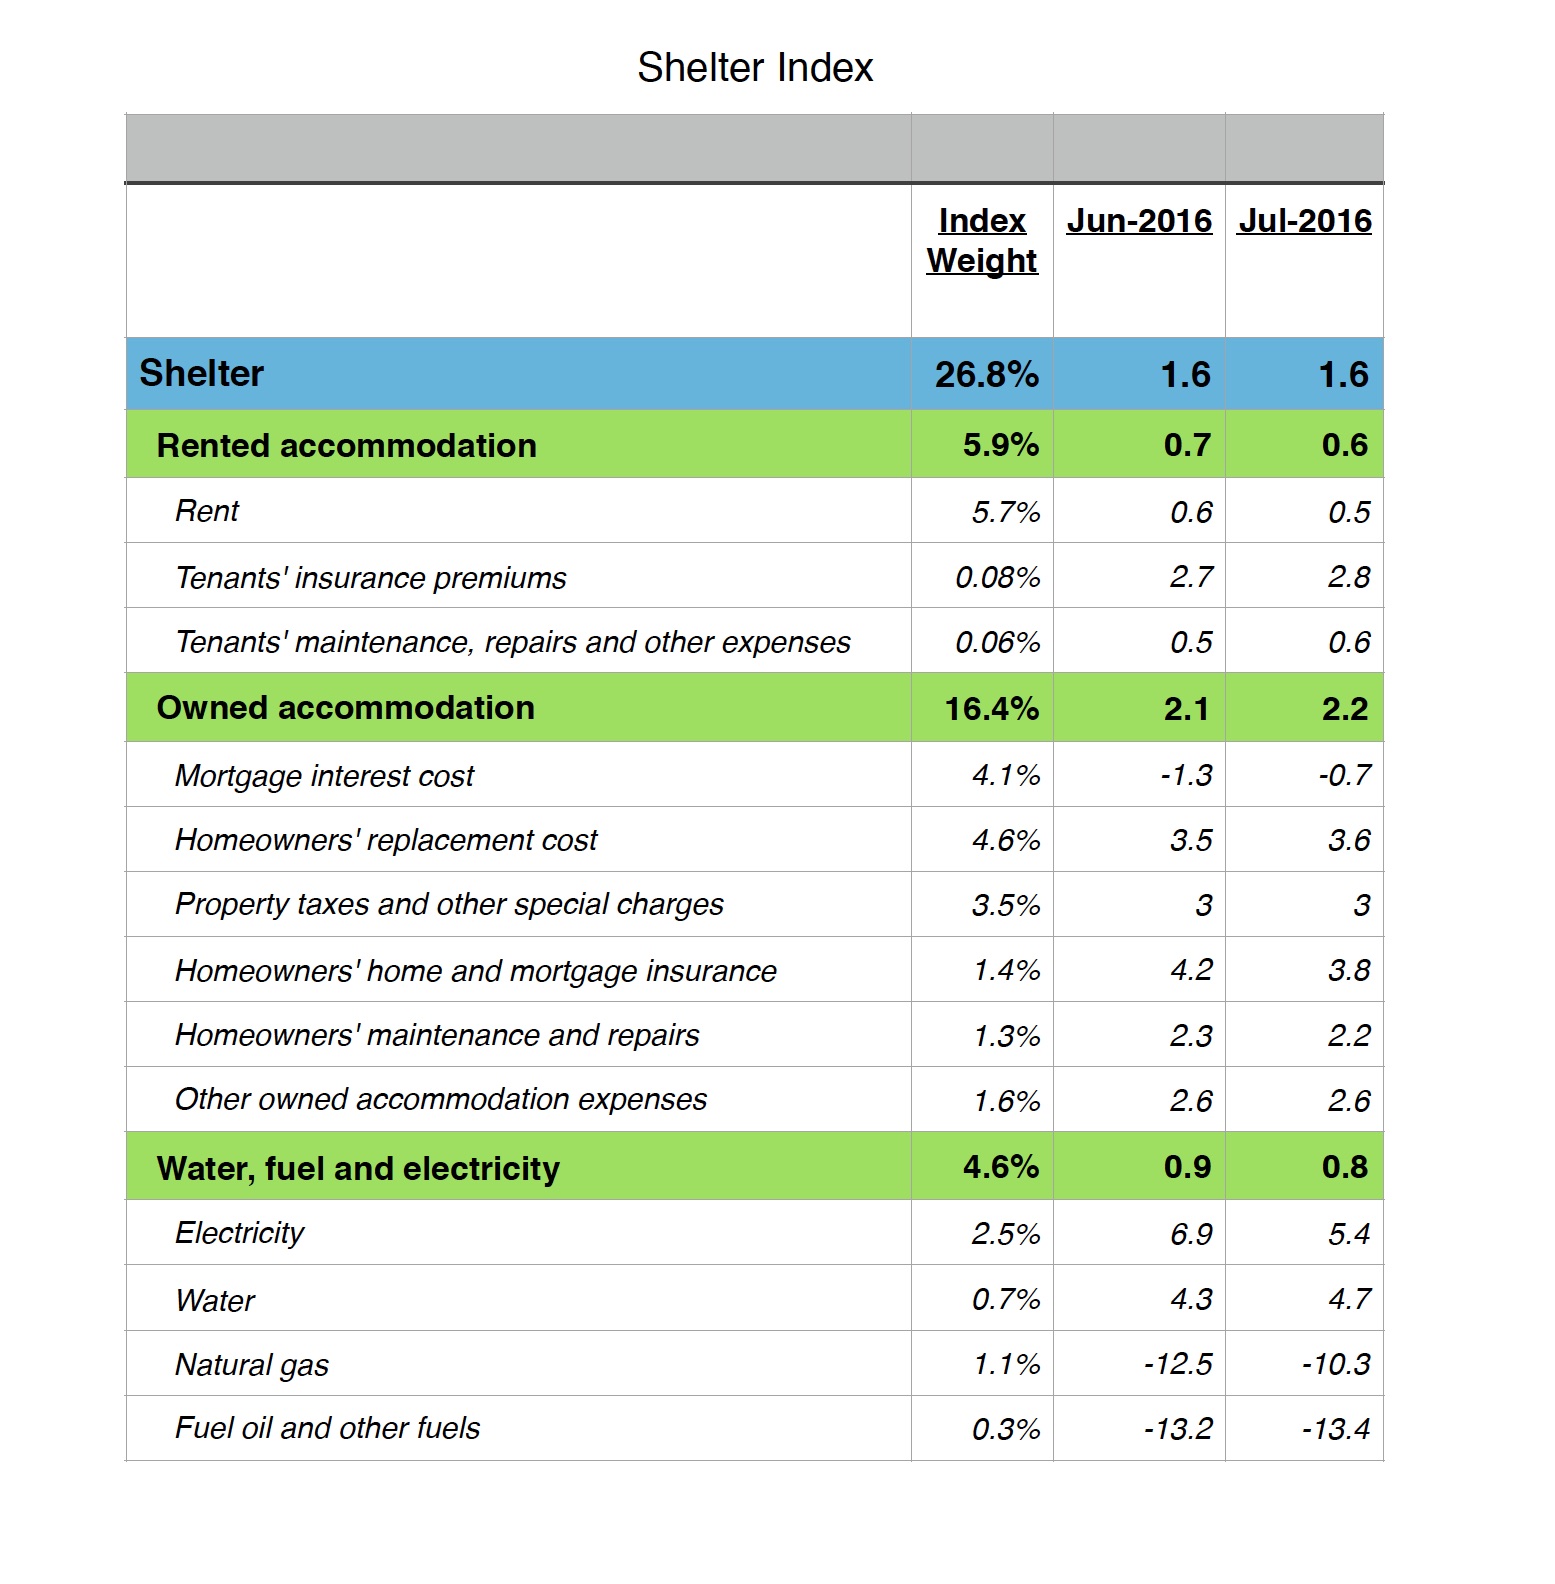
Bolstering annual inflation, the index for alcoholic beverages and tobacco products increased more than any other major component of consumer spending, up 3.2% annually in July compared to 3.0% in June. Of the major components, recreation, education and reading had the next highest inflation rate for the year at 1.9%. The indexes for food and shelter, which together make up over 43% of the CPI, both added 1.6% over the year. At the grocery store, prices inched up only 1.1% annually in July, while the cost of food purchased from restaurants was 2.7% higher over the same period.
Within the shelter index, rented accommodation costs only added 0.6% while owned accommodation costs jumped 2.2%. Rent reportedly climbed only 0.5% year-over-year in July. Over the same period, the index for homeowners home and mortgage insurance was 3.8% higher and the index for homeowners replacement costs grew by 3.6%. Also included in the shelter index is the index for water, fuel and electricity, which was up 0.8% annually. Spikes in the prices of water and electricity were offset by tumbling electricity and fuel costs.
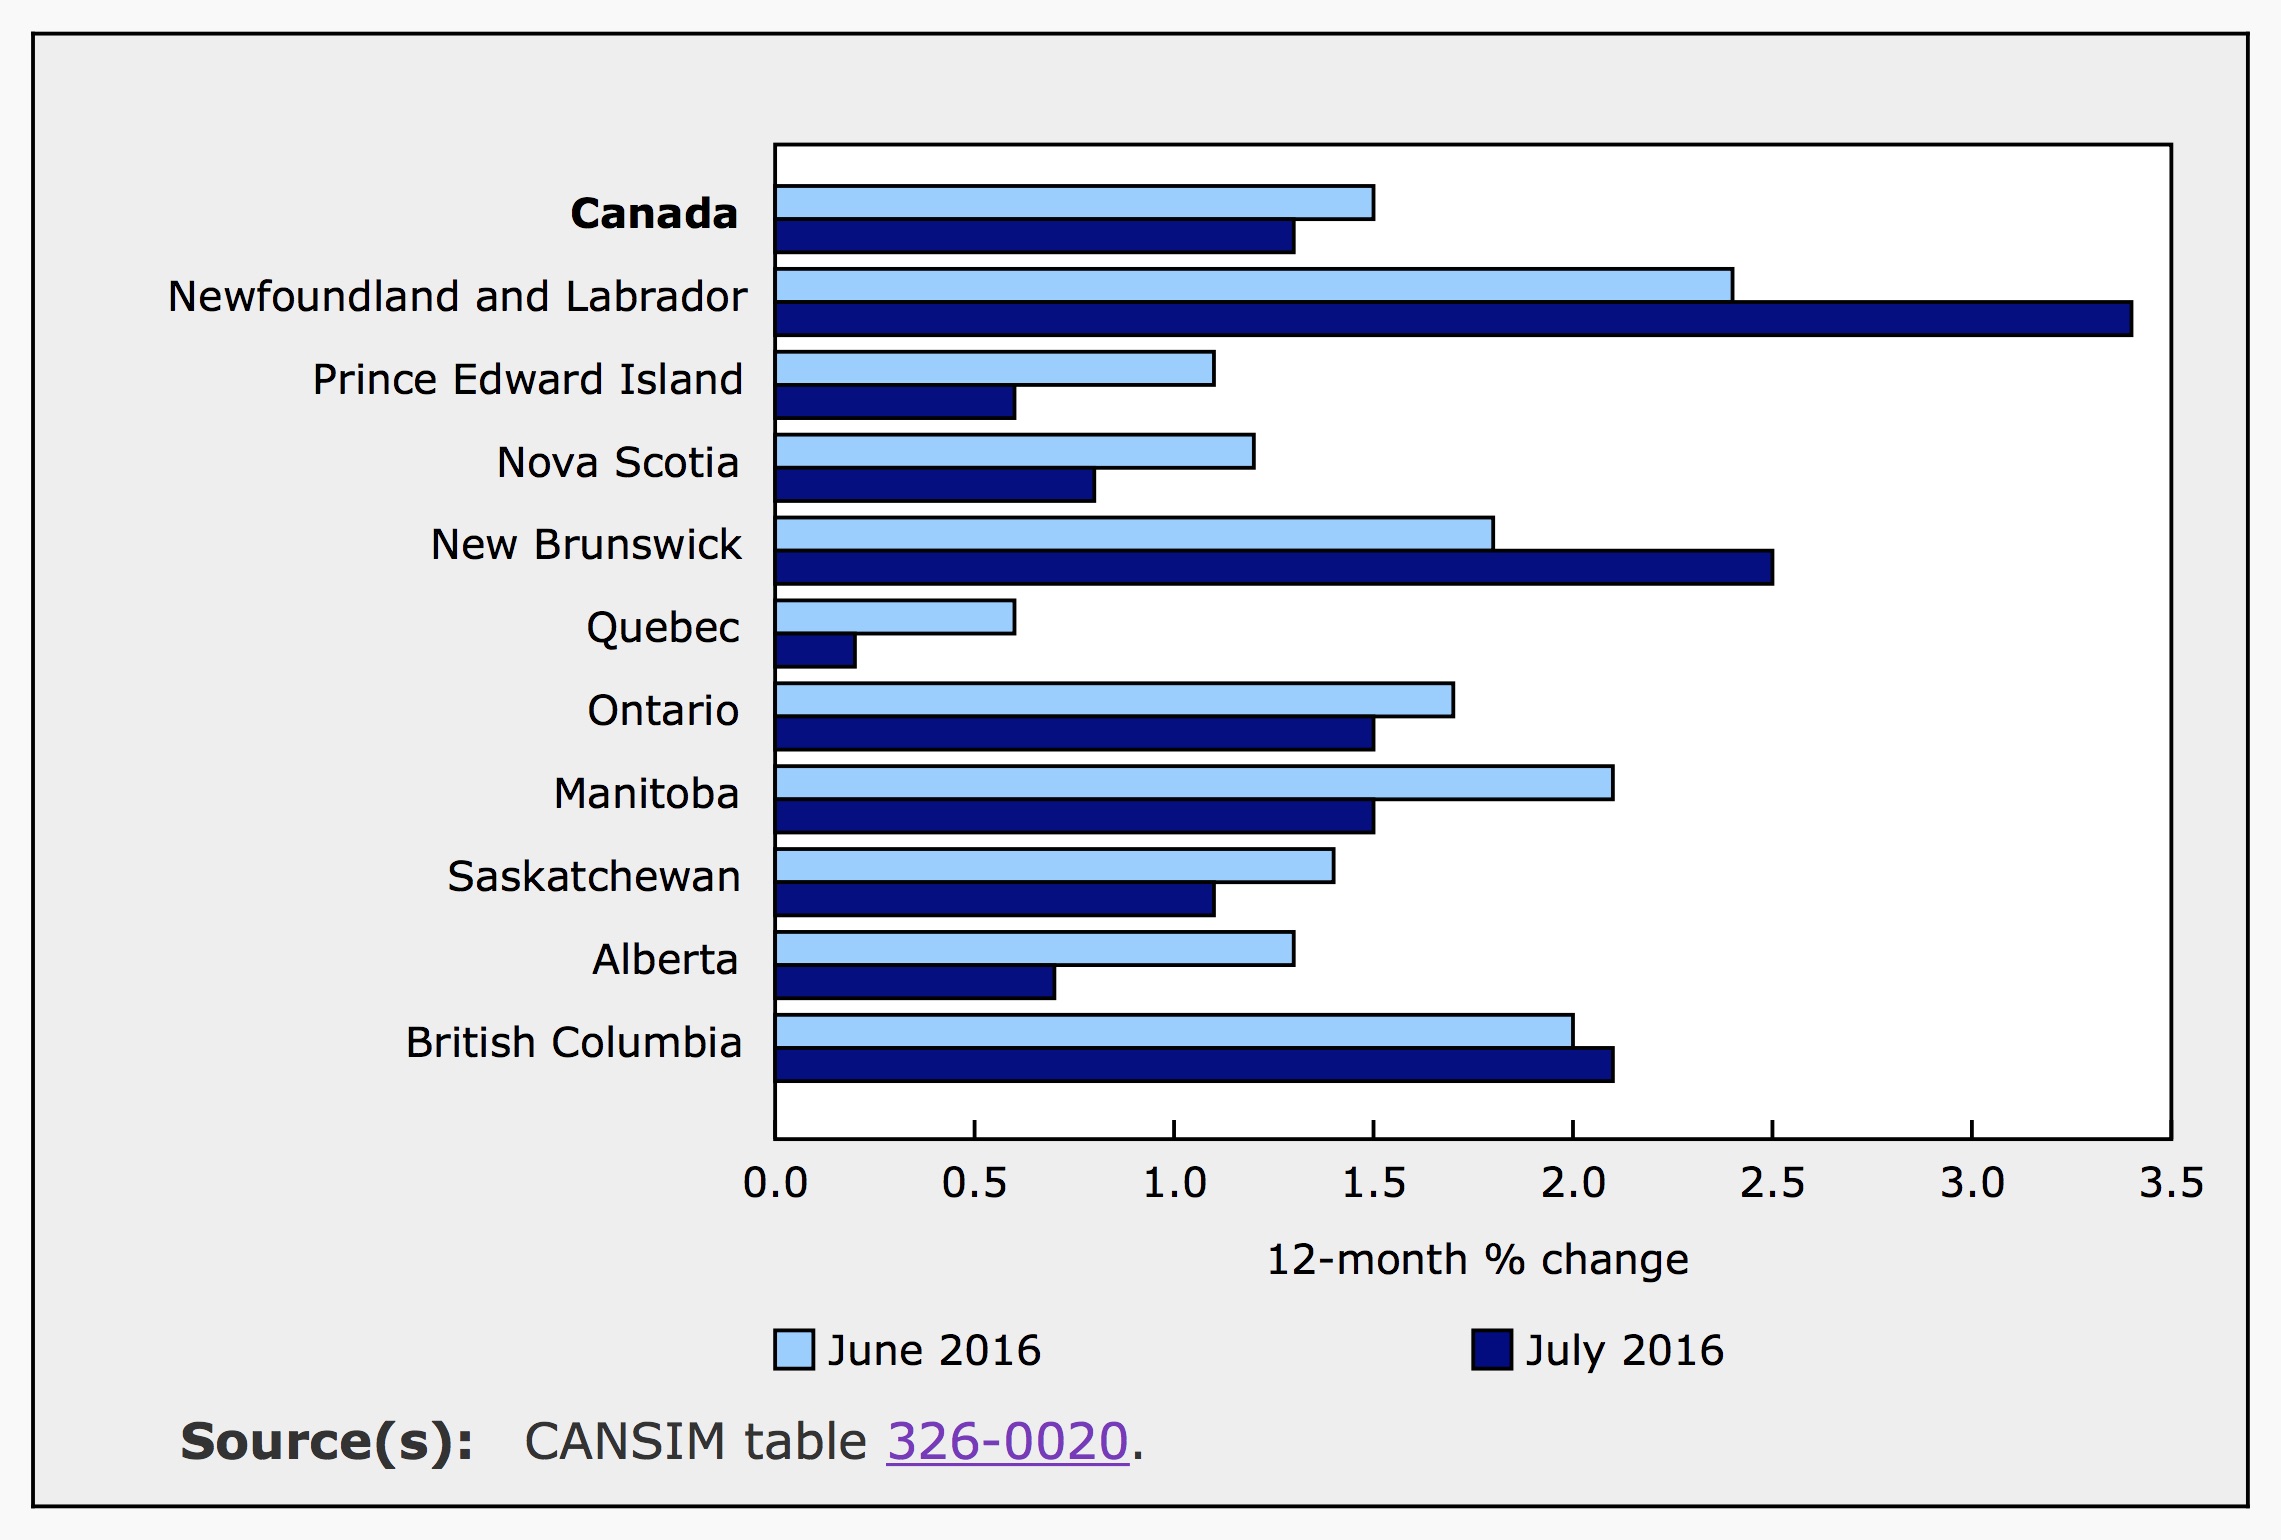
Inflation in the Provinces
Prices were higher in every province in July on an annual basis. However, inflation slowed in seven provinces in July compared to June. Inflation accelerated in Newfoundland and Labrador, New Brunswick and British Columbia in July. Newfoundland and Labrador and New Brunswick were impacted by a 2% increase in HST on July 1st.
In Quebec, the price of gas declined more than it has in the rest of the country. The transportation index declined 2% in Quebec for the year ending in July compared to a decline of 0.2% for the country as a whole. At the pump, gas prices were down 16.3% in Quebec on an annual basis compared to 14% for all of Canada.
Outlook
According to Bank of Canada’s July monetary policy report:
…inflation has recently been a little higher than anticipated, largely due to higher consumer energy prices, it is still in the lower half of the Bank’s inflation-control range. Most measures of core inflation remain close to 2%…the Bank projects that inflation will average close to 2% throughout 2017 as the output gap narrows.
The next meeting to announce a potential change to interest rate policy is scheduled for September 7th. No change is expected at that point. Because the Canadian economy is beginning to show renewed signs of weakness, there are some expectations that rates will be cut this year to spur growth. However, Canadians have high levels of household debt and lower rates would encourage more borrowing. Also, with rates at 0.5% there is little room left to move and the impact of a rate cut at this point could be negligible.
Emily is a Canadian financial blogger with multiple degrees in economics and extensive professional experience as a financial analyst. She was formerly a Ph.D. candidate at the University of Guelph's School of Agricultural Economics. Before that, she received an MA from the University of San Francisco in International Development Economics. She also has a BA in Math with a minor in Economics.